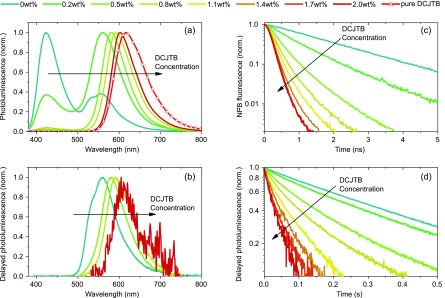
Figure 2.
Spectroscopic data taken at room temperature and in nitrogen for material blends consisting of 2 wt % donor and the indicated concentration of acceptor molecules. (a) CW illumination shows a red shift in emission wavelength with increasing acceptor concentration, indicating a transfer from the donor’s energy states toward the acceptor’s singlet. (b) The same holds true when examining only delayed spectra. Looking at the donor’s lifetime, one can see a decrease with increasing acceptor concentration for both the singlet (c) and triplet (d) state. Even though the delayed PL transients contain contributions from both molecular species, the figure still represents the donor’s triplet population because the acceptor’s singlet lifetime is in the nanosecond range. Note that all images are raw data, deconvoluted for further investigation in the case of (c).

