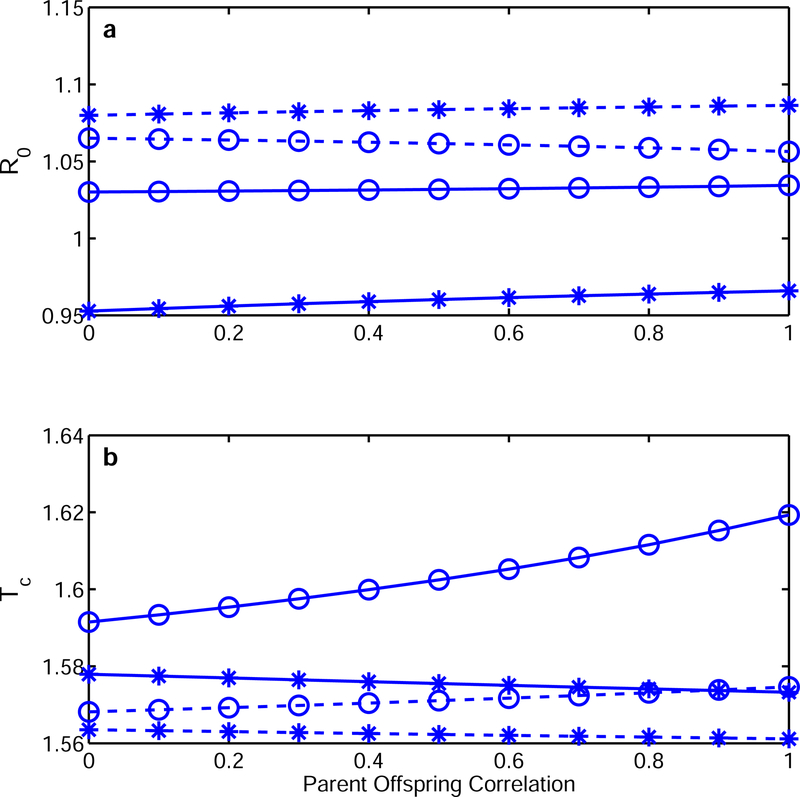
Figure 3.
a) level of reproduction R0 and b) generation time Tc along a gradient of parent-offspring correlation (0= no correlation, 1= perfect transission of relative size between the parent and the offspring). Dashed lines show estimates under weak selection, the solid lines resemble strong selection. Starred values obtain when there is negative correlation between growth and size (g = 0.25); circles are values for the case of positive correlation between growth and size (g = 0.75).

