Figure 1.
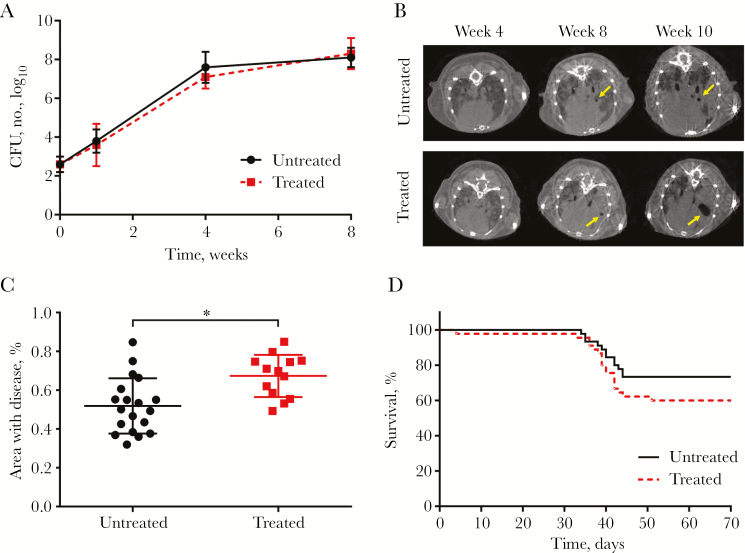
Effect of cipemastat in Mycobacterium tuberculosis–infected mice. A, Pulmonary bacterial burden, represented as the number of colony-forming units (CFU), in treated and untreated animals after infection. B, Transverse computed tomographic images of representative mice that developed cavitary lesions (yellow arrows) 4, 8, and 10 weeks after infection. C, Disease severity 10 weeks after infection, quantified as the percentage of lung involved with disease, as seen on hematoxylin-eosin stained sections, was significantly higher in 13 treated mice, compared with 19 untreated controls. *P = .003. D, Survival of infected mice treated with cipemastat was lower than that among controls. Data are means ± standard deviations.

