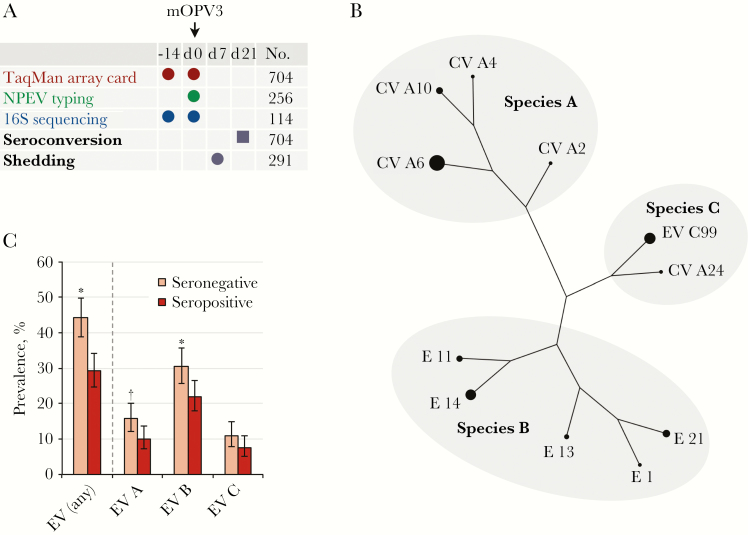
Figure 1.
Association between nonpolio enteroviruses (NPEVs) and seroconversion. A, Study design. Circles represent stool samples; square, serum sample. “No.” column lists numbers of per-protocol infants. B, Enterovirus (EV) serotypes with a prevalence of ≥1%. The diameter of the circle at each branch tip is proportional to serotype prevalence. Phylogenetic relationships are as described by Oberste and colleagues [7]. Branch lengths are not proportional to phylogenetic distance. C, Enterovirus prevalence by seroconversion status. Error bars indicate 95% confidence intervals. *P < .01; †P < .05. Abbreviations: CV, coxsackievirus; E, echovirus; mOPV3, monovalent type 3 oral poliovirus vaccine.

