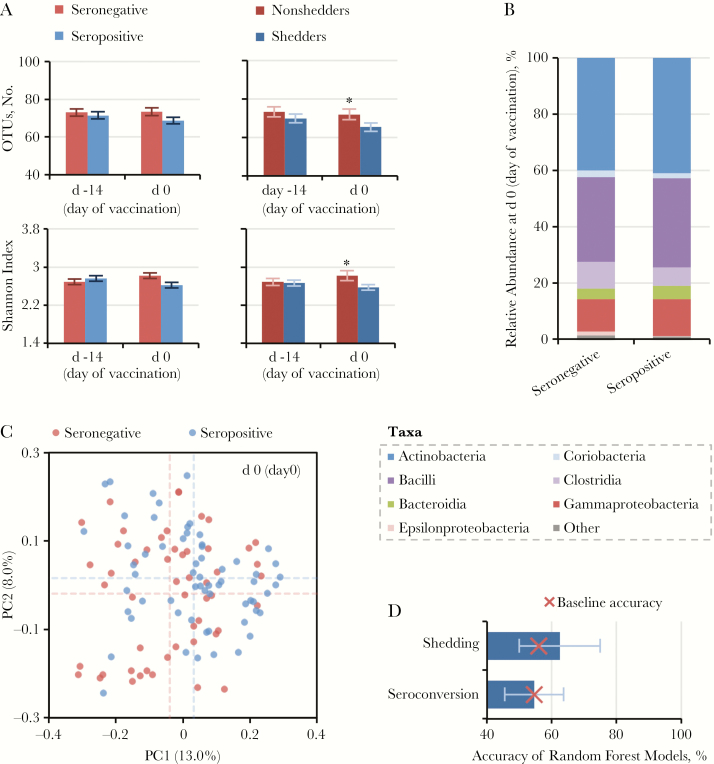
Figure 2.
Association between microbiota composition on day of vaccination (day 0) and seroconversion. A, Operational taxonomic unit (OTU) count and Shannon index (presented as means with standard errors). B, Class-level composition of the bacterial microbiota. C, Unweighted UniFrac distances between samples, visualized using principal coordinate analysis. Mean values for each principal coordinate are indicated by dotted lines. D, Cross-validation accuracy of Random Forest models based on OTU abundance data (medians with interquartile ranges). The baseline accuracy is the expected accuracy if all individuals are assigned to the majority class. *P < .05; Abbreviations: PC, principal coordinate 1. Note- d 0 (day of vaccination) , d -14 (day of starting azithromycin or placebo)

