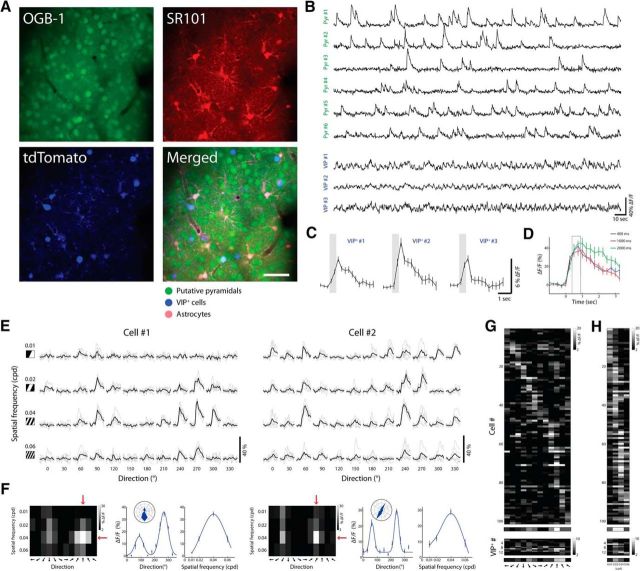
Figure 1.
In vivo imaging of visual-evoked responses of layer 2/3 neurons. A, Top, Two-photon image from a VIP-Cre x tdTomato mouse loaded with OGB-1 (left) and SR101 (right) in layer 2/3 of V1. Scale bar, 50 μm. Bottom, Same FOV at 1040 nm excitation showing VIP+ cells expressing tdTomato (left) and the merged image of the three (right). B, Ca2+ responses of putative pyramidal cells and VIP+ cells during visual evoked activity using drifting gratings stimuli. C, Averaged visually evoked Ca2+ responses of three VIP+ cells (420 ms stimulus, averaged over 12 directions; shaded gray box). D, Example of Ca2+ responses time course of one cell, evoked by its preferred stimulus at different stimulus durations (400, 1000, and 2000 ms). Tuning matrices (shown below) were generated by averaging ΔF/F over two frames after stimulus onset (F0+2, F0+3, where F0 is stimulus onset frame) marked by gray box. E, Ca2+ responses of two neurons displayed as a matrix of all stimulus conditions. Columns indicate the direction of motion of the gratings and rows indicate their SF. Each trial is shown in gray (n = 5); average response across trials of a given stimulus is shown in black. F, Tuning matrix and tuning curves of the cells shown in E. Left, Response matrices evoked by each stimulus shown in E. Pixel intensity corresponds to the average ΔF/F over two frames after stimulus presentation and over five repetitions. Red arrows point to the preferred direction and preferred SF. Middle, Direction tuning curves illustrated in Cartesian and polar axes fitted with a double Gaussian. Right, SF tuning curves fitted with DOG (solid curve). Plots are mean ± SEM. G, Top, Direction tuning of an example network showing a raster plot of putative pyramidal cells with OSI >0.3. Each pixel represents the mean response of a cell to 12 directions at its preferred SF. Cells are sorted according to the direction that drives the largest response. Bottom, Same for VIP+ cells. H, Top, SF tuning of the same network as in G. Each pixel represents the mean response of a cell to 4 SFs of gratings moving in the preferred direction. Cells are sorted according to the SF driving the largest response. The averaged tuning curve of the network is shown below (n = 101 cells). Bottom, Same for VIP+ cells and their average (n = 14 cells).

