Figure 3.

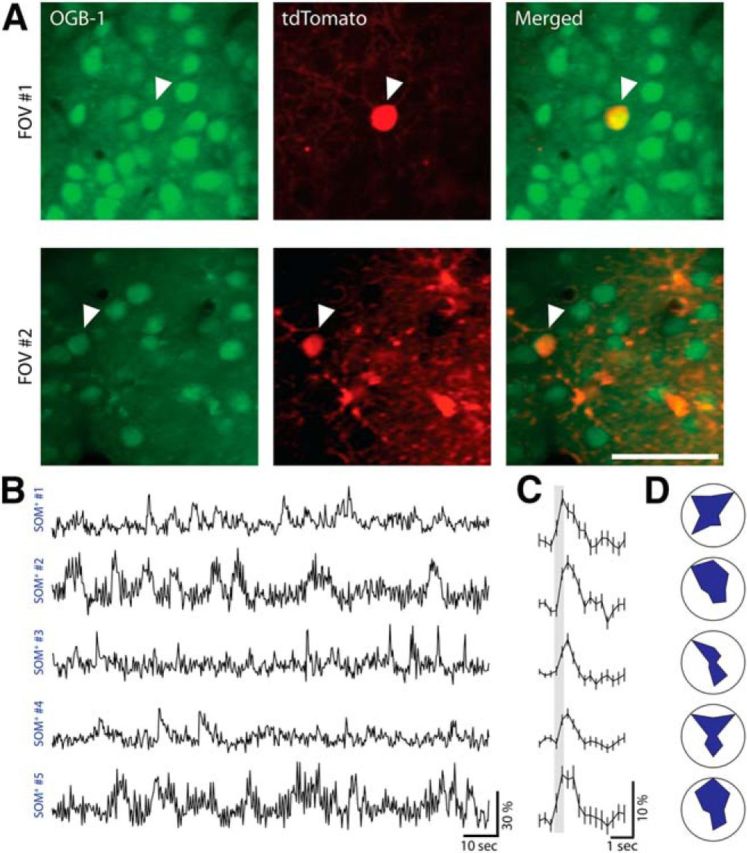
SOM+ interneurons are active under light anesthesia. A, Left, Two-photon images of two FOVs from SOM-cre::LSL-tdTomato mice bolus loaded with Oregon Green Bapta-1 AM (OGB-1) in upper layer 2/3 of V1 at 950 nm excitation. Middle, Same FOVs at 1040 nm excitation showing SOM+ cells expressing tdTomato. Right, Merged images of the two. Scale bar, 50 μm. B, Ca2+ responses of five SOM+ cells from two mice measured under light isoflurane anesthesia showing active SOM+ cells. C, Averaged visual-evoked responses of five SOM+ cells shown in A (420 ms stimulus marked with a shaded gray box, averaged over eight directions, eight trials each; mean ± SEM). D, Polar plots of the normalized tuning curves for five SOM+ cells shown in A and B (each point represents the mean response over eight trials normalized by the maximum response).
