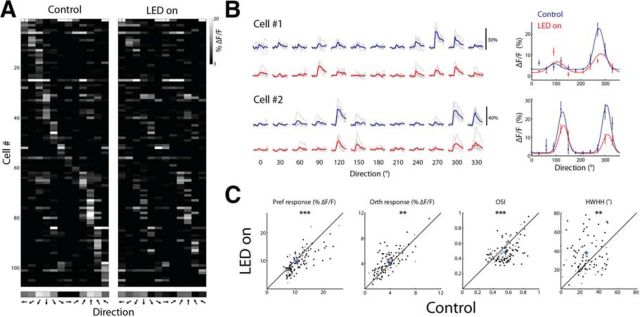
Figure 5.
Optogenetic activation of VIP+ cells alters orientation selectivity. A, Direction tuning matrix of an example network from a VIP-cre::LSL-tdTomato mouse injected with DIO-C1V1-YFP showing a raster plot of putative pyramidal cells with OSI >0.3 (n = 107) in control and LED-on conditions. Each pixel represents the mean response (ΔF/F) of a cell to 12 directions at its preferred SF. Cells are sorted according to the direction that drives the largest response in the control condition. Bottom, Averaged tuning curve of the network. B, Left, Ca2+ traces of two examples of responsive neurons displayed as a matrix of all direction of motion at the preferred SF. Each trial is shown in gray (n = 5) and the average response across trials of a given stimulus is shown in blue or red in the control or LED-on condition, respectively. Right, Tuning curves fitted with a double Gaussian of the cells shown on the left. Plots are mean ± SEM. C, Scatter plots comparing various parameters in control and LED-on conditions. Shown are the response amplitude (ΔF/F) to the preferred direction (Pref), the response amplitude to the orthogonal direction (Orth), OSI, and HWHH. Each circle represents a cell and cross represents population average. Black circles depict cells with a significant change in their response amplitude to any stimulus between the control and LED-on condition (n = 86) and gray circles depict cells with no significant change (n = 21; p < 0.001; t test with Bonferroni multiple-comparisons correction).

