
Figure 2.
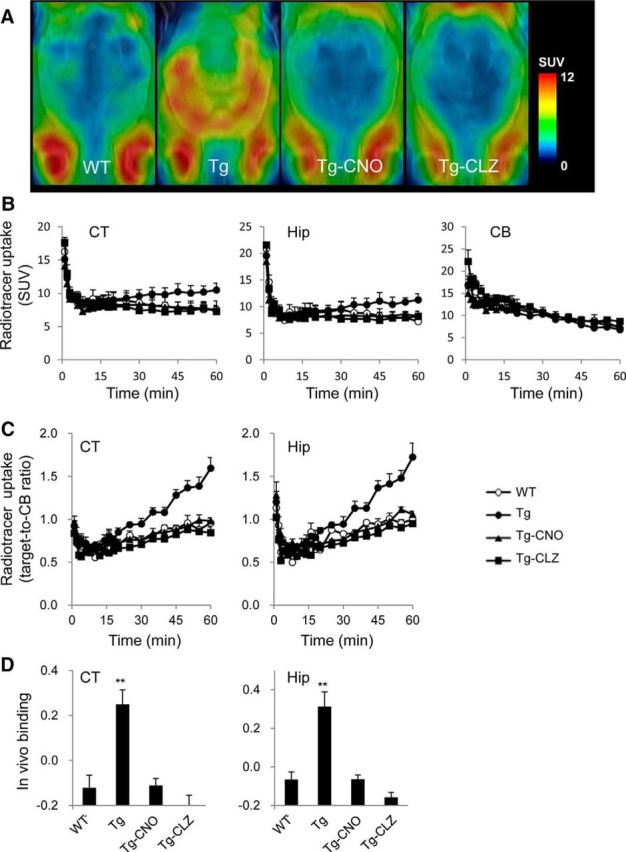
In vivo PET measures in the brains of WT and hM4Di Tg mice after intravenous injection of [11C]CNO. A, [11C]CNO PET imaging in WT and hM4Di Tg mice. The PET images of [11C]CNO generated from averaged dynamic data (30–60 min) are overlapped with the MRI template of mouse horizontal brain sections. From left to right, the images are representative data from WT and hM4Di Tg mice and hM4Di Tg mice pretreated with CNO (Tg-CNO) and CLZ (Tg-CLZ). Radioligand accumulation in putative Harderian glands was observed around the bottom of each image and was assumed to be nonspecific because it was not blocked by the pretreatments. B, C, [11C]CNO uptake quantified as standardized uptake value (SUV; percentage of injected dose per milliliter tissue × body weight in grams) (B) and target-to-reference ratio of radioactivity (C) in the neocortex (CT), hippocampus (Hip), and cerebellum (CB; selected as a reference region) of WT (open circles) and hM4Di Tg (filled circles) mice and hM4Di Tg mice pretreated with CNO (Tg-CNO, filled triangles) and CLZ (Tg-CLZ, filled squares; n = 4–5 in each group) over the scan time. D, In vivo binding of [11C]CNO determined as target-to-cerebellum ratio of radioactivity (average of data at 30–60 min) − 1. There was a significant main effect of group on in vivo binding in CT (F(3, 14) = 13.19, p < 0.01 by one-way ANOVA) and Hip (F(3, 14) = 15.38, p < 0.01 by one-way ANOVA), and the binding in untreated Tg mice was significantly higher than that in the other three groups (**p < 0.01 by post hoc Bonferroni's test). No statistically significant differences were found between any two of WT, Tg-CNO, and Tg-CLZ groups in either CT or Hip. Error bars indicate SE.