
Figure 4.
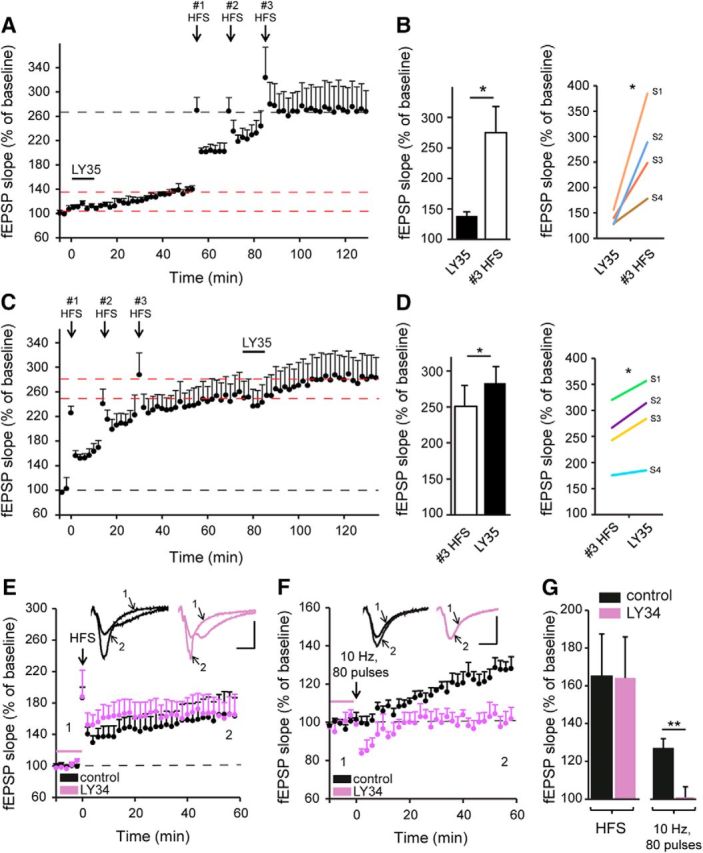
Two modes of LTP induction, either by HFS or by group II mGlu receptor activation, do not mutually occlude each other. A, LTP induced by group II mGlu receptor activation (LY354740, 1 μm, 10 min) reached a peak steady-state level after 45 min. At this point, HFS (3 trains at 100 Hz for 1 s separated by 20 s) repeated 3 times leads to a significant further increase in LTP. B, Quantification of fEPSP slope changes under the conditions presented in A. Two-tailed paired Student's t test. Left, Means for all slices. Right, Responses for each slice. C, In reverse order experiments, HFS was applied three times to achieve saturating LTP. Subsequent pharmacological activation of group II mGlu receptor activation induced a further increase in LTP. D, Quantification of fEPSP slope changes under the conditions presented in C. Two-tailed paired Student's t test. Left, Means for all slices. Right, responses for each slice. E, LTP induction by HFS (3 × 100 Hz, ISI: 20 s) is not impaired by group II mGlu receptor antagonist (LY341495, 4 μm, 10 min). F, LTP induced by 80 pulses at 10 Hz is blocked by a group II mGlu receptor antagonist (LY341495, 4 μm, 10 min). G, Quantification of fEPSP slope changes under the conditions presented in E and F. *p < 0.05, **p < 0.01, two-tailed unpaired Student's t test. Scale bars, 0.5 mV and 10 ms.