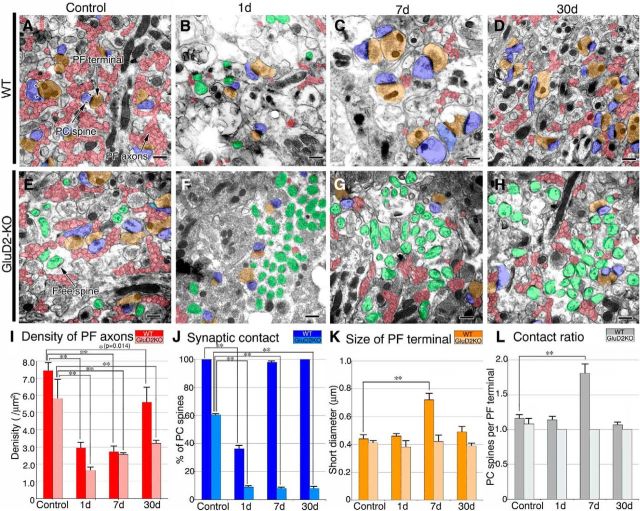
Figure 2.
Changes in PFs and PF synapses after surgical transection. A–H, Electron micrographs of the superficial molecular layer in sham-operated control (A, E) and PF-transected mice on postlesion days 1 (B, F), 7 (C, G), and 30 (D, H) in wild-type (A–D) and GluD2-KO (E–H) genotypes. PF axons and terminals are pseudocolored in red and orange, respectively, whereas PC spines in contact with PF terminals or lacking synaptic contact (ie, free spines) are in blue or green, respectively. Pairs of arrowheads indicate the PSD. I–L, Bar graphs showing the density of PF axons per square micrometer of the molecular layer (I), the percentage of PC spines in contact with PF terminals (J), the size (short diameter) of PF terminals (K), and the contact ratio of PC spines per PF terminal (L; mean ± SD, n = 3 mice for each). Left and right bars represent scores in wild-type and GluD2-KO mice, respectively. Differences between sham-operated control and PF-transected mice in each genotype were assessed using ANOVA with Dunnett's test. **p < 0.01, *p < 0.05 (actual p value is indicated in the parenthesis). Scale bars, 500 nm.

