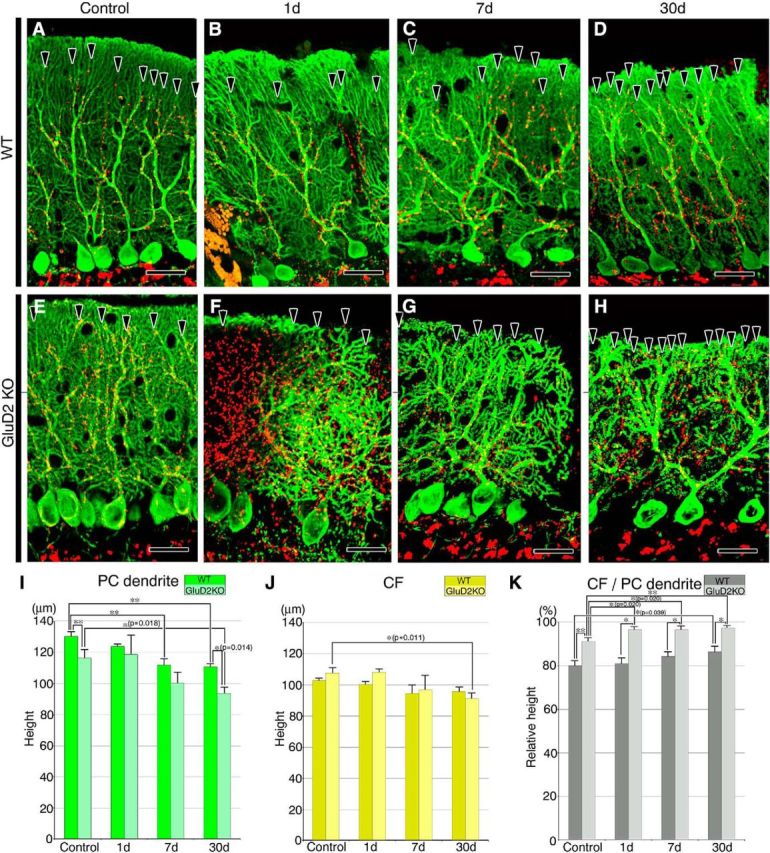
Figure 4.

Changes in molecular layer thickness and CF reach after PF transection. A–H, Double-immunofluorescence for calbindin (green) and VGluT2 (red) in sham-operated control (A, E), and PF-transected mice on postlesion days 1 (B, F), 7 (C, G), and 30 (D, H) in wild-type (A–D) and GluD2-KO (E–H) genotypes. Arrowheads indicate the distal tips of VGluT2-labeled CF terminals. I–K, Bar graphs showing the vertical height to the tips of calbindin-positive PC dendrites (ie, molecular layer thickness; I) or to the tips of VGluT2-labeled CF terminals (ie, CF reach; J), and the CF reach relative to molecular layer thickness (K; mean ± SD, n = 3 mice for each). Differences between sham-operated control and PF-transected mice in each genotype were assessed using ANOVA with Dunnett's test, while those between wild-type and GluD2-KO mice at each time point were assessed using Student's t test. **p < 0.01, *p < 0.05 (actual p values are indicated in the parenthesis). Scale bars, 25 μm.
