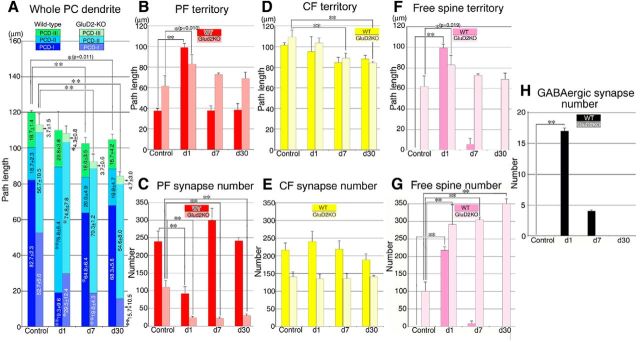
Figure 8.
Changes after PF transection in the path length of innervation territories and in the number of PF synapses, CF synapses, free spines, and spine-type GABAergic synapses. A, The path length (μm) of whole single dendritic tracts and of PCD-I (blue), PCD-II (cyan), and PCD-III (green). B, The path length of the PF territory (ie, PCD-II + PCD-III). C, PF synapse number in the PF territory. D, The path length of the CF territory (ie, PCD-I + PCD-II). E, CF synapse number in the CF territory. F, The path length of dendrites studded with free spines. G, Free spine number. H, Spine-type GABAergic synapse number. Left and right bars represent scores in wild-type and GluD2-KO mice, respectively. All scores were measured from three mice at each time point for each analysis, and expressed as the mean ± SD. Differences between sham-operated control and PF-transected mice in each genotype were assessed using ANOVA with Dunnett's test. **p < 0.01, *p < 0.05 (actual p values are indicated in the parenthesis).

