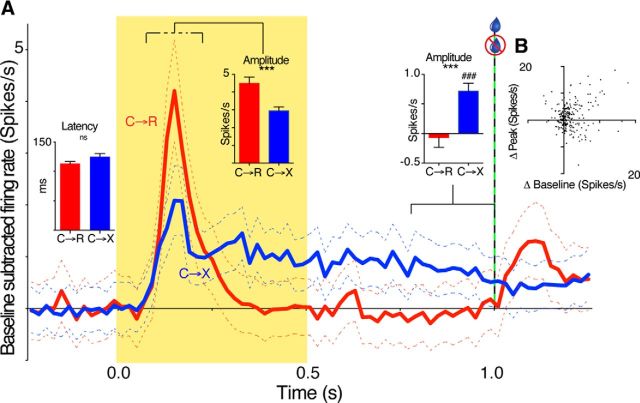
Figure 3.
Population analysis of neural responses to task events. A, Main graph traces show grand mean (±SEM) baseline-subtracted PETH from all neurons with an excitatory response in at least one block for C→R (red) and C→X (blue) blocks. Inset bar graphs show mean ± SEM of, from left to right, the latency of all phasic peaks that ended within 275 ms of cue onset, the average baseline-subtracted amplitude of phasic peaks, and the mean baseline-subtracted firing rate over last 250 ms of the presolenoid period. Dashed line above the peak period indicates that the measured period was variable, being set for each individual according to peak onset and offset times. ns, Not significant; ***p < 0.001, paired t test, n = 234; ###p < 0.001, 1-sample t test, compared with 0; n = 234. B, Scatter plot shows the relationship for each cell of the difference in baseline-subtracted firing rate of excitatory peaks between C→R and C→X blocks (Δ peak), and the difference in baseline firing rate between the blocks (Δ baseline). One outlier data point (respective values 31, 27 spikes/s) is omitted from the graph but was included in the statistical analysis. There was no significant correlation.

