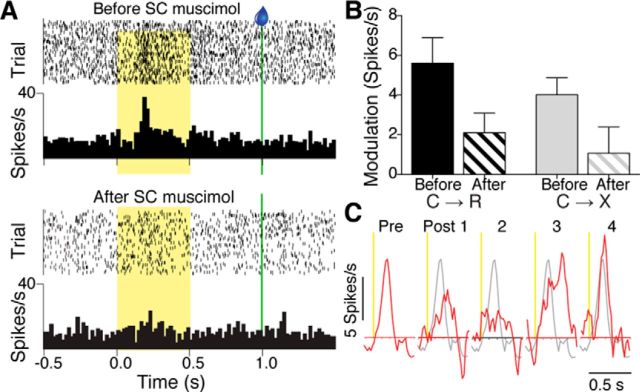
Figure 6.
Effect of SC inactivation on cue responses of midline thalamus neurons. A, Rasters and histograms showing response of a midline thalamus neuron to light cue in reward blocks recorded before (top) and after (bottom) infusion of muscimol into SC. B, Graph showing mean + SEM modulation amplitude for phasic responses of midline thalamus neurons to cue onset in C→R (n = 10) and C→X blocks (n = 8) before and after SC muscimol infusion. There was a significant main effect of time (before vs after; p = 0.0016, two-way repeated-measures ANOVA) and no significant interaction. C, Red traces showing response of a midline thalamus neuron to light cue onset in C→R (vertical yellow line) from smoothed (5-bin running average), baseline normalized average PETH before (Pre), and after SC muscimol infusion over 4 sequential 50-trial blocks of C→R (Post 1–4). The premuscimol response profile (gray line) is superimposed on each subsequent block for comparison.

