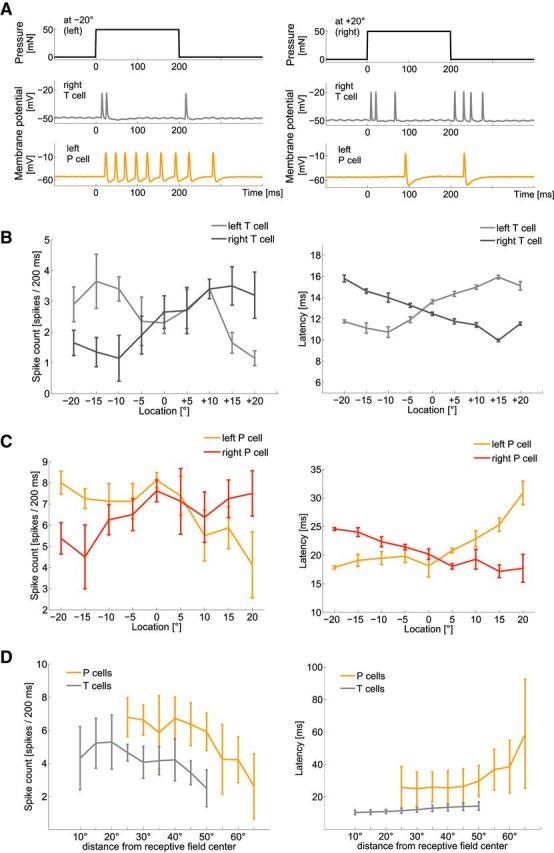
Figure 3.

Influences of touch location on neuronal responses of mechanoreceptors. A, Typical example of simultaneously intracellularly recorded responses of a right T cell (gray) and left P cell (orange) to a pressure stimulus of 50 mN for 200 ms at −20° (left) and +20° (right). B, Spike count and latency (mean and SD) of a typical T-cell double-recording with 10 repeated presentations of estimation task “location” (Table 1): a stimulus intensity of 50 mN applied for 200 ms at varied locations. Ventral midline is defined as 0°, stimulus locations to the right as positive and to the left as negative numbers of degrees. C, Spike count and latency (mean and SD of 10 responses) of a typical P-cell double-recording responding to the same stimulation as used in B. D, Dependencies of spike count and latency on stimulus location (mean and SD of the mean activity of 10 T cells and 10 P cells responding to 8–10 stimulus repetitions). Responses of left and right cells were pooled, displaying distances from receptive field centers rather than absolute stimulus locations on the body wall. The curves of both cell types are shifted relative to each other, because the receptive field centers of P cells are at −45° and 45°, and of T cells at −30° and 30° (Lewis and Kristan, 1998). Hence, stimulation of both cell types from −20° to +20° around the midline led to larger distances from receptive field centers of P cells than of T cells.
