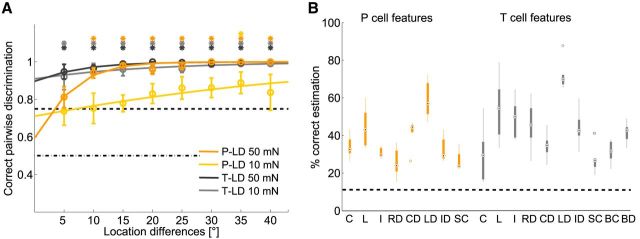
Figure 4.
Estimation results for stimulus location. A, Pairwise discrimination results for tactile stimulation at 0° compared with stimulus locations between 5° and 40°. Responses of T and P cells (5 TT and 5 PP cell double-recordings, 8–10 stimulus presentations for each cell) were analyzed for two stimulus intensities, 10 and 50 mN. The black dashed lines show chance level and 75% threshold. Asterisks indicate mean values that are significantly (p < 0.05, t test) above threshold. B, Classification result for nine locations of a 50 mN pressure stimulus. Black dashed line shows chance level, black dots mark the median values, and circles indicate statistical outliers (see Material and Methods). Response features: C, spike count; L, latency; I, first ISI; RD, response duration; CD, spike count difference; LD, latency difference; ID, first ISI difference; SC, summed spike count; BC, burst spike count; BD, burst duration.

