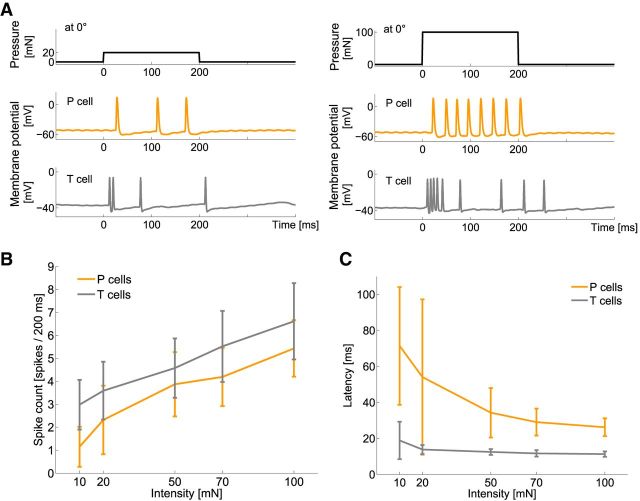
Figure 5.
Influences of stimulus intensity on neuronal responses of mechanoreceptors. A, Typical example of simultaneously, intracellularly recorded responses of a T cell (gray) and a P cell (orange) to a mechanical stimulus of 20 mN (left) and 100 mN (right) for 200 ms at 0° (ventral midline). B, C, Dependencies of B spike count and C latency on stimulus intensity. Mean and SD of 27 T cells (gray) and 22 P cells (orange) with 10 stimulus repetitions each, for intensities of 5–100 mN applied at 0° (Table 1, estimation task intensities high).

