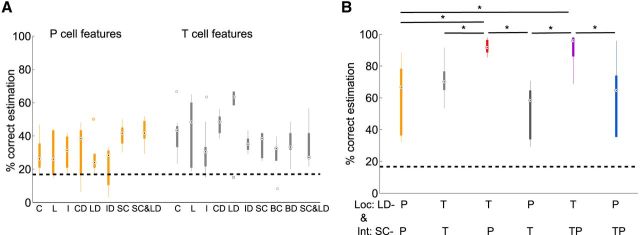
Figure 8.
Estimation results for combination of location and intensity. A, Estimation results for combination of three locations (−20°, 0°, 20°) and two intensities (10 and 50 mN; Table 1, estimation task: location and intensity). C, Spike count; L, latency; I, first ISI; CD, spike count difference; LD, latency difference; ID, first ISI difference; SC, summed spike count; BC, burst spike count; BD, burst duration. Black dashed lines show chance level black dots mark median values, and circles indicate statistical outliers. B, Results for combination of summed spike count (SC) for intensity estimation (Int) and latency difference (LD) for location estimation (Loc) for the same location and intensity estimation task as in A. P-cell pairs in orange; T-cell pairs in light gray. Pooled data analysis: P cell SC and T cell LD in red, and T cell SC and P cell LD in dark gray; SC of P cell and T cell pooled data with LD of T cells in purple and with LD of P cells in blue. In the top row of the x-axis labels, the cells used for location estimation based on latency differences are listed; the second row shows cells used for intensity estimation based on summed counts. Asterisk indicates significant difference between estimation results (p < 0.05, Kruskal–Wallis test).

