Figure 3.
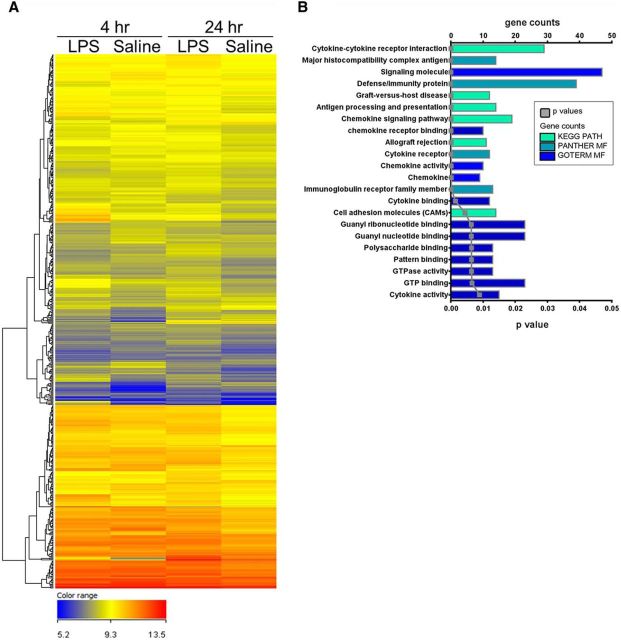
Gene expression changes triggered by systemic LPS in the epileptic hippocampus. A, Microarray heat map of the 533 genes differentially expressed at both 4 and 24 h in the hippocampus of LPS- versus saline-treated epileptic mice. A color code scale was used to show gene expression differences in logarithmic fold change units between the groups (blue represents lowest expression; red represents higher expression). B, Overrepresented gene ontology categories of genes differentially expressed in the hippocampus of LPS- versus saline-treated chronically epileptic mice, at both 4 and 24 h after treatment. Differentially expressed genes (533 in total) were classified by DAVID software, applying Benjamini-corrected p value cutoff of 0.05. The most significant categories are displayed at the top of the graph to downward (p value, gray line) and gene number arranged horizontally by the length of the bars (gene counts, colored bars). KEGG PATH, PANTHER MF, and GOTERM MF indicate the databases used for gene classification (KEGG, Panther Molecular Function, and GOterm Molecular Function, respectively; for details, see Materials and Methods).

