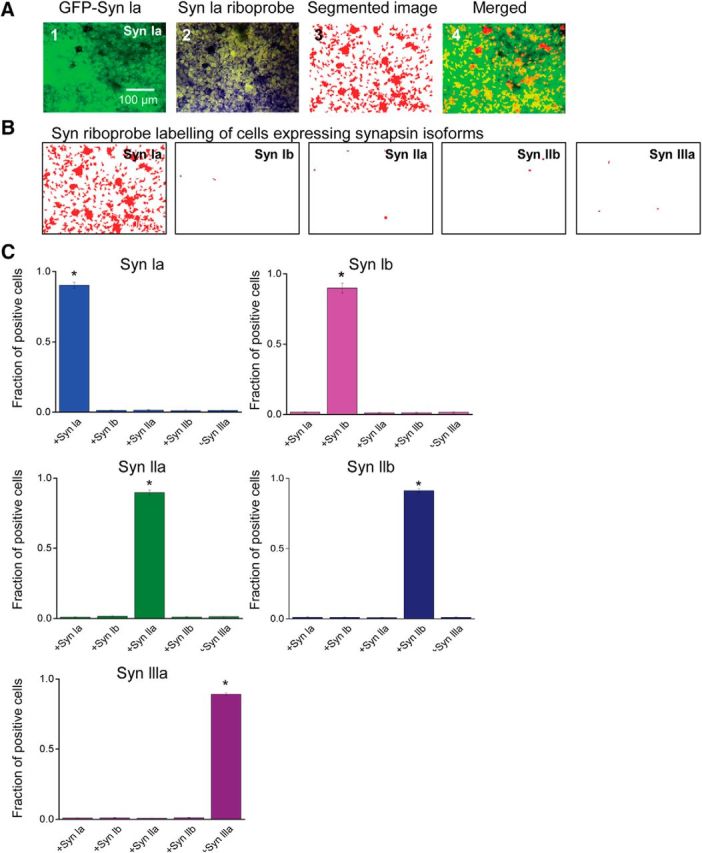
Figure 1.

Specificity of riboprobes for ISH. A, Detection of labeling. A1, Expression of GFP-tagged synapsin Ia in HEK 293T cells. A2, ISH (blue color) with the synapsin Ia riboprobe for the same field shown in A1. A3, Image shown in A2 was segmented (orange) by using intensity and area thresholds to define locations where ISH occurs. Segmented image from A3 was merged with the fluorescence image from A1, revealing that ISH occurred in nuclei of cells expressing synapsin Ia. B, A synapsin Ia riboprobe was used to probe HEK cells expressing the indicated synapsin isoforms and segmented images, as in A3, were used to visualize ISH. Only cells expressing synapsin Ia exhibited appreciable ISH, demonstrating the specificity of the synapsin Ia probe. C, ISH data were analyzed by counting the number of cells with positive nuclear signals. Each synapsin riboprobe significantly labeled only cells expressing the cognate synapsin isoform, validating the specificity of each riboprobe. Asterisks indicate p < 0.05 by t test or ANOVA with Holm–Bonferroni post hoc test.
