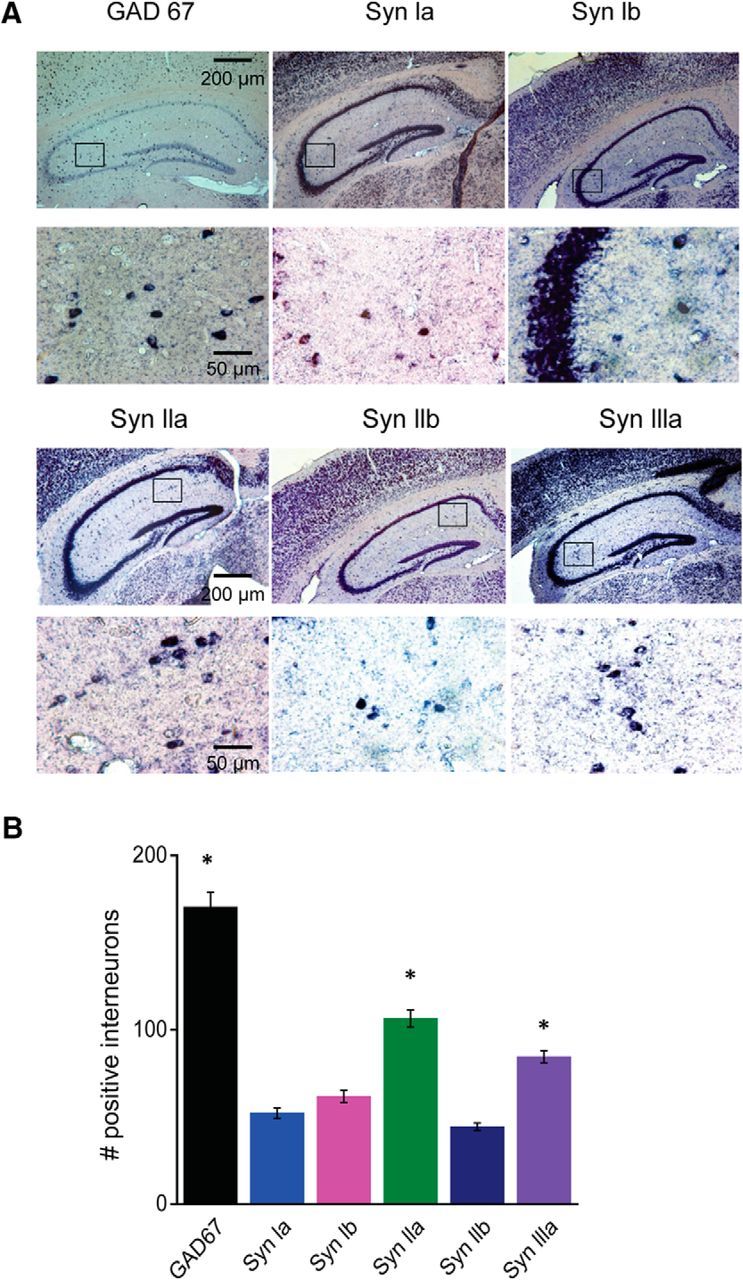
Figure 3.

Expression of synapsin isoforms in hippocampal interneurons. A, Representative ISH images from mouse hippocampal sections using the indicated riboprobes. Top rows of images were taken at low magnification, whereas bottom rows show high-magnification images taken from the areas indicated by rectangles in the low-magnification images. B, Quantification of labeling of interneurons by the indicated riboprobes. Interneurons were identified by their location outside of pyramidal cell or granule cell layers. The GAD67 and synapsin IIa and synapsin IIIa groups are significantly different from each other and from the other groups (asterisks indicate p < 0.05 by ANOVA with Holm–Bonferroni post hoc test). Values indicate mean number (±SEM) of labeled cells per section. Number of sections are as follows: GAD67 (10), synapsin Ia (16), synapsin Ib (16), synapsin IIa (21), synapsin IIb (14), and synapsin IIIa (17), taken from six different mouse brains.
