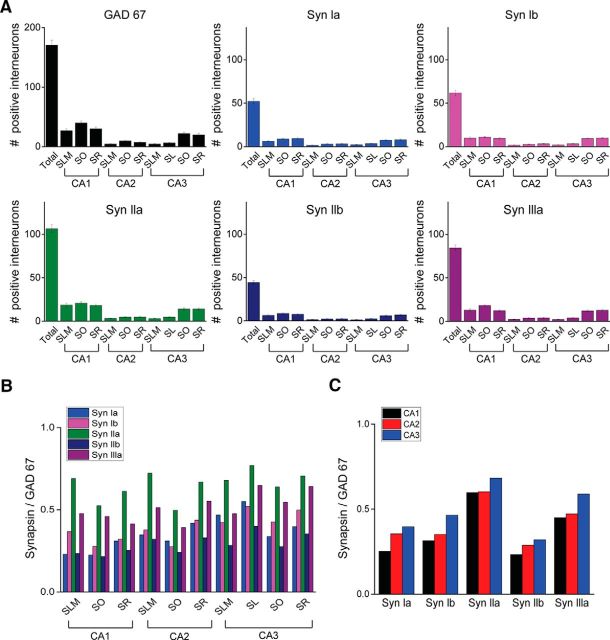
Figure 4.
Distribution of synapsin expression in hippocampal interneurons. A, Labeling of interneurons in indicated regions with indicated riboprobes. Values indicate mean number (±SEM) of labeled cells per section. Note change in y-axis scale between GAD67 and synapsin probes. B, C, Synapsin isoform expression was normalized by GAD67 expression and compared across the indicated hippocampal regions. DG, Dentate gyrus; SLM, stratum lacunosum-moleculare; SO, stratum oriens; SR, stratum radiatum; SL, stratum lucidum.

