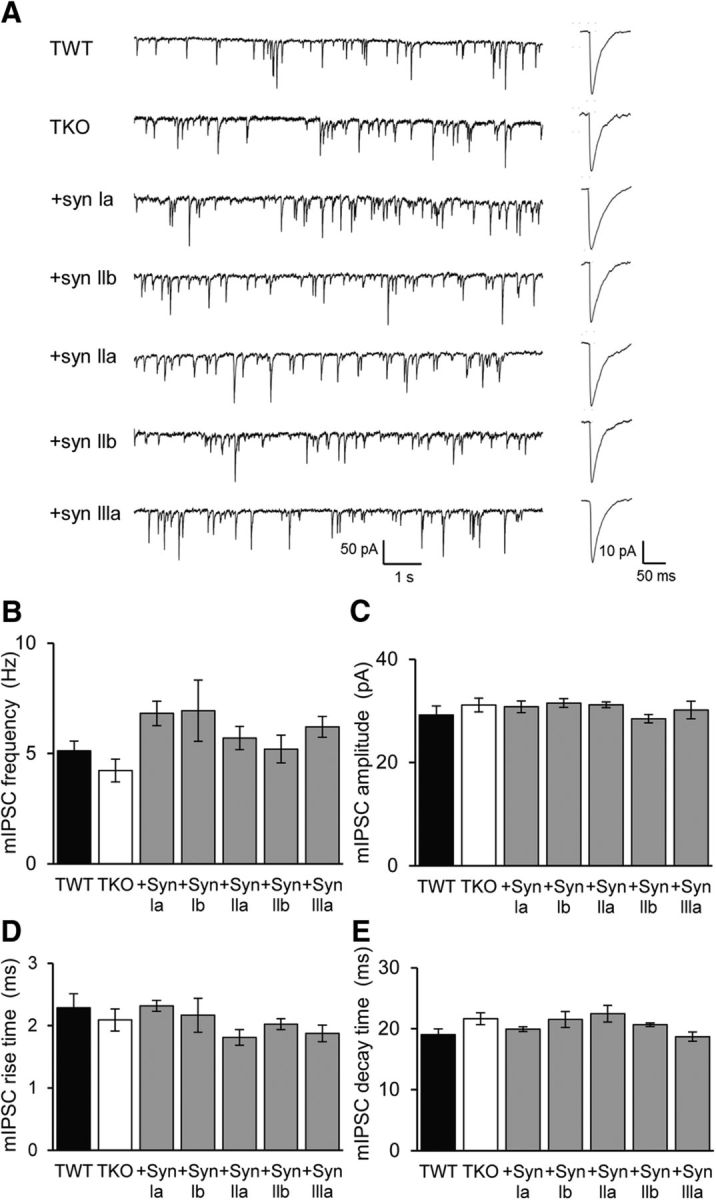
Figure 7.

Properties of mIPSCs. A, Left, representative traces of mIPSCs recorded in TWT and TKO neurons, as well in TKO neurons expressing indicated synapsin isoforms. Right, Averaged mIPSCs. In each case, mIPSCs were sampled for 60 s. B, Mean mIPSC frequency of TWT (black, n = 15) and TKO (white, n = 12) neurons, as well as TKO neurons expressing indicated synapsin isoforms (shaded). Sample sizes for each isoform are: synapsin Ia (20), synapsin Ib (11), synapsin IIa (11), synapsin IIb (25), and synapsin IIIa (15). C–E, Effects of synapsin isoforms on amplitude (C), rise time (D), and decay time (E) of mIPSCs. For B–E, statistical comparisons were done with ANOVA, followed by Holm–Bonferroni post hoc test; there were no significant differences (p > 0.05).
