Figure 9.
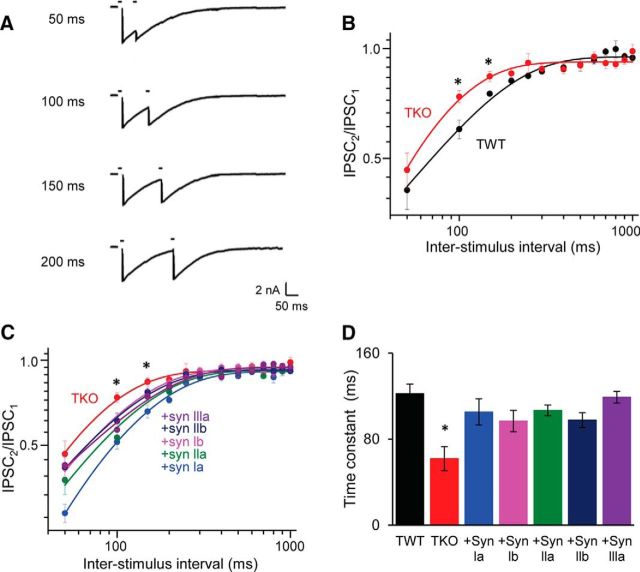
Recovery from synaptic depression measured with pairs of stimuli delivered at various interstimulus intervals. A, Examples of depression of eIPSCs in a TWT neuron. B, Kinetics of recovery from depression for TWT (black, n = 16) and TKO (red, n = 17) neurons (note logarithmic coordinates). Depression was less for TKO neurons at 100 and 150 ms interstimulus intervals. Statistical comparisons were done with unpaired t test; asterisks indicate significant differences (p < 0.05). C, Comparison of recovery from depression for TKO neurons, as well as TKO neurons expressing indicated synapsin isoforms (note logarithmic coordinates). Sample sizes are as follows: synapsin Ia (17), synapsin Ib (21), synapsin IIa (15), synapsin IIb (23), and synapsin IIIa (15). D, Mean time constants of recovery from depression for each genotype, determined as in C. Depression recovered significantly faster in TKO neurons For C and D, statistical comparisons were done with ANOVA, followed by Holm–Bonferroni post hoc test; asterisks indicate significant differences (p < 0.05).

