Figure 1.

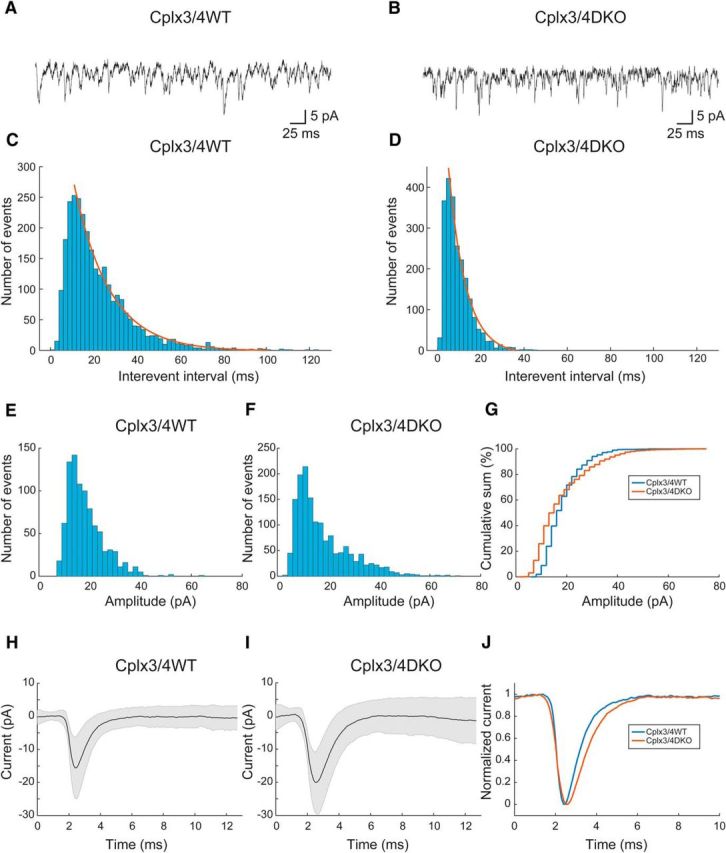
Horizontal cell activity in Cplx3/4 WT and Cplx3/4 DKO mouse retinas. A, B, EPSCs recorded at −60 mV holding potential from a horizontal cell body in a slice preparation of a Cplx3/4 WT (A) and a Cplx3/4 DKO (B) retina. C, D, Interevent interval histograms of EPSCs recorded from horizontal cells of Cplx3/4 WT (C) and Cplx3/4 DKO (D) retinas. Histograms were fitted each with a single-exponential function as indicated by the solid lines. Parameters derived from the fits were AWT = 532, τWT = 11.35 ± 0.30 ms (R2 = 0.9911, n = 2829) and ADKO = 850, τDKO = 5.56 ± 0.32 ms (R2 = 0.98797, n = 2271). Bin width = 2 ms. E, F, Amplitude histograms were constructed from individual EPSCs recorded from Cplx3/4 WT (E) and Cplx3/4 DKO (F) retinas. Bin width = 2 pA. G, Amplitude distribution of EPSCs plotted as cumulative sum for Cplx3/4 WT and Cplx3/4 DKO mouse retinas. Bin width = 2 pA. H, Average EPSC from Cplx3/4 WT (n = 655 events, 3 cells). I, Average EPSC from Cplx3/4 DKO (n = 908, 6 cells). Shaded areas in G and H indicate ± 1 SD. J, Overlay of normalized average EPSCs from Cplx3/4 WT and Cplx3/4 DKO.
