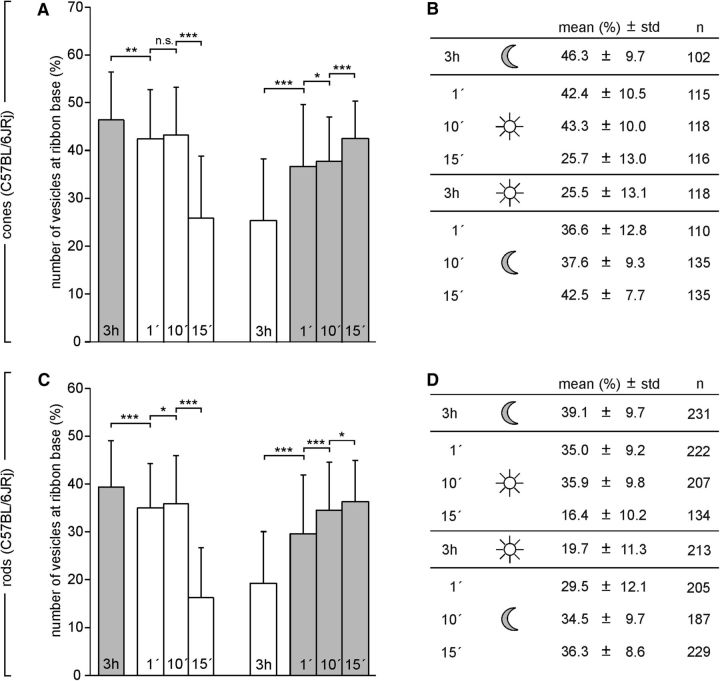
Figure 11.
Quantification of synaptic vesicles associated with the ribbon base in C57BL/6JRj cone and rod photoreceptors after varying durations of light or dark. A, C, Percentage (mean ± SD) of vesicles at the ribbon base in cone photoreceptor ribbons (A) and rod photoreceptor ribbons (C) from C57BL/6JRj retinas fixed after different periods of light adaptation (1, 10, 15 min, white bars) and after different periods of dark adaptation (1, 10, 15 min, gray bars). *p < 0.05, **p < 0.01, ***p < 0.001, t test. B, D, Summary of the quantitative data. n = number of quantified ribbons.

