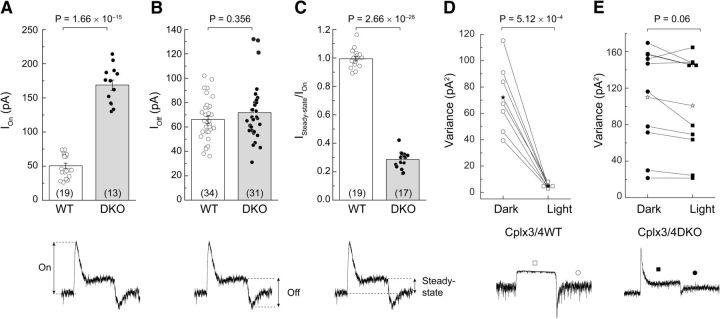
Figure 4.
Comparison of horizontal cell light responses from Cplx3/4 WT and Cplx3/4 DKO mouse retinas. A, Combined bar graph and scatter plot of peak amplitudes measured at light onset corresponding to the inhibition of tonic inward current. Values differ significantly (t test). B, Combined bar graph and scatter plot of peak amplitudes measured at light offset. Values do not differ significantly (t test). C, Combined bar graph and scatter plot of current ratios measured under steady-state conditions (Isteady-state) and at light onset (ION). Values differed significantly (t test). D, Pairwise plot of current variance measured in dark and light for horizontal cells from Cplx3/4 WT retina. Values differ significantly (paired t test). E, Pairwise plot of variance measured in dark and light for horizontal cells from Cplx3/4 DKO retina. Values differ significantly (paired t test). Asterisks in D and E indicate arithmetic mean. Some data points are plotted horizontally for clarity. Numbers in parentheses in A–C denote the number of observations. p-values are given above the plots. Parameters for measurements are exemplified below for Cplx3/4 DKO current traces.

