
Figure 8.
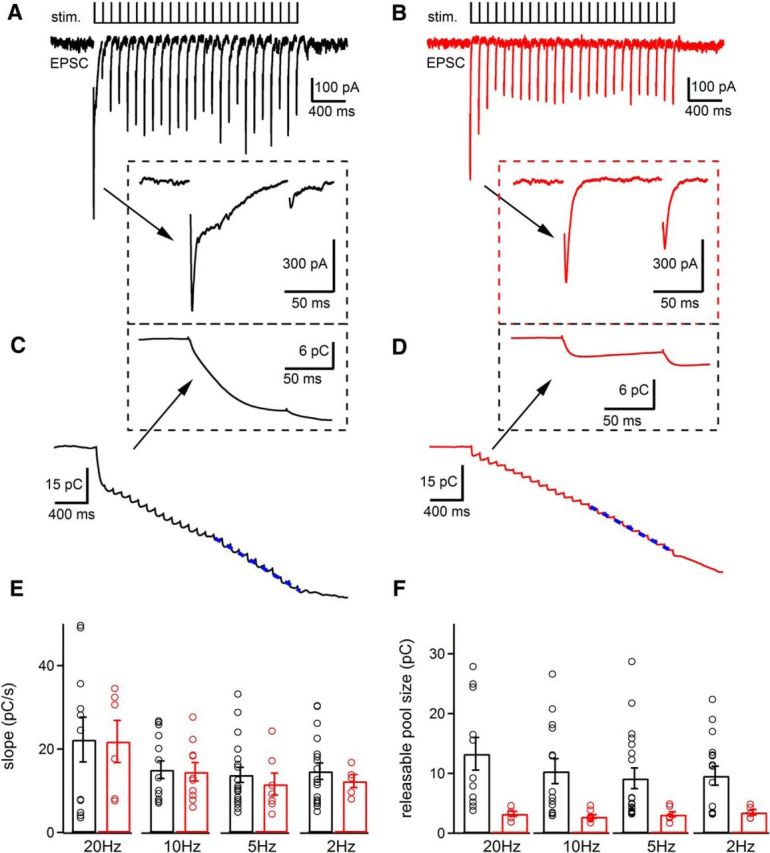
EPSCs evoked by trains of electrical stimulation reveal similar synaptic vesicle replenishment rates but altered releasable pool size in Cplx3/4 WT and Cplx3/4 DKO mouse photoreceptors. A, EPSCs were evoked by a train of electrical stimulation (1 ms, 13 V, 10 Hz, 25 stimuli) in a horizontal cell from Cplx3/4 WT retina. Inset shows the responses to the first two stimuli at higher temporal resolution. Stimulation artifacts were removed for clarity. B, EPSCs recorded from a horizontal cell from Cplx3/4 DKO retina with the same stimulus train. Inset shows the responses to the first two stimuli at higher temporal resolution. C, Charge transfer during a train of EPSCs recorded from a horizontal cell from Cplx3/4 WT retina shown in A. Inset depicts the charge transfer for the first two stimuli at higher temporal resolution. D, Charge transfer during a train of EPSCs recorded from a horizontal cell from Cplx3/4 DKO retina in B. Inset depicts the charge transfer for the first two stimuli at higher temporal resolution. The dotted blue lines in C and D represent a linear fit to the charge transfer measured during the last 10 stimuli. E, Slope values revealing replenishment rates were obtained by fitting linear regression lines to the cumulative charge transfer as shown in C and D. Slope values for horizontal cells from Cplx3/4 WT and Cplx3/4 DKO retinas were not significantly different for all stimulation frequencies tested (2 Hz: p = 0.53, n = 11 and 6; 5 Hz: p = 0.39, n = 19 and 6; 10 Hz: p = 0.87, n = 14 and 10; 20 Hz: p = 0.95, n = 11 and 6, unpaired t test). F, Comparison of releasable pool size measured with electrical stimulation at frequencies of 2, 5, 10, and 20 Hz. Values showed significant differences between Cplx3/4 WT and Cplx3/4 DKO photoreceptors (2 Hz: p = 0.05; 5 Hz: p = 0.045; 10 Hz: p = 0.006; 20 Hz: p = 0.017, unpaired t test). Holding potential in all experiments was −60 mV.