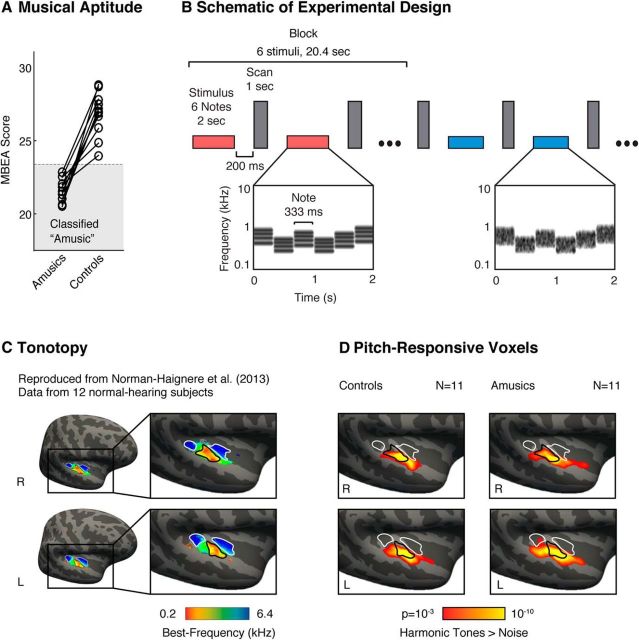
Figure 1.
Schematic of experimental design and maps of pitch responses. A, Amusic subjects were identified using a standard musical aptitude test: the Montreal Battery of Evaluation of Amusia (MBEA). Each amusic subject was paired with a corresponding age- and education-matched control (matched pairs are indicated by connecting lines). B, Schematic of the experimental design. fMRI responses were measured to harmonic tones and Gaussian noise spanning the same frequency range. Contrasting responses to these stimuli in typical listeners reveals anatomically stereotyped “pitch-responsive” regions that overlap low- but not high-frequency tonotopic areas of primary auditory cortex (Norman-Haignere et al., 2013). Stimuli (denoted by horizontal bars) were presented in a block design, with six stimuli from the same condition presented successively in each block (red and blue indicate different conditions). Each stimulus (2 s) included several notes that varied in frequency to minimize adaptation. Cochleograms are shown for an example harmonic tone stimulus (red bar) and an example noise stimulus (blue bar). Cochleograms plot time–frequency decompositions, similar to a spectrogram, that summarize the cochlea's response to sound. After each stimulus, a single scan was collected (vertical, gray bars). C, Group tonotopic map reproduced from Norman-Haignere et al. (2013) and used here for comparison with pitch-responsive voxels (D). Colors indicate the pure-tone frequency with the highest response in each voxel. Black and white outlines indicate regions of low- and high-frequency selectivity, respectively. D, Voxels with a significant response preference for harmonic tones compared with frequency-matched noise (cluster-corrected to p < 0.001). In both amusics and controls, we observed significant clusters of pitch-responsive voxels that partially overlapped the low-frequency area of primary auditory cortex.

