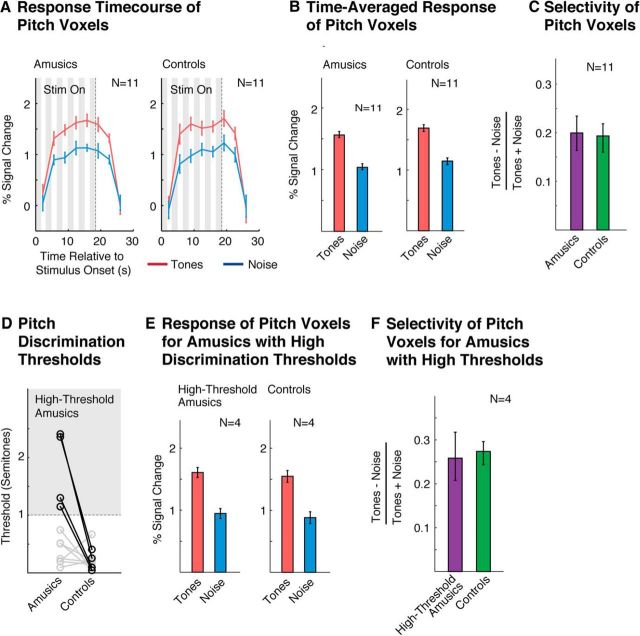
Figure 2.
Pitch selectivity measured using functional ROIs. A, Response time course of pitch-responsive voxels to harmonic tones and noise, measured using an ROI analysis (see in “Functional ROI analyses” in the Materials and Methods). Gray regions indicate times when the stimulus was being played. The response to the stimulus is delayed because the BOLD response builds up slowly in response to neural activity. B, Time-averaged response to each condition (calculated using an HRF). C, Selectivity of the time-averaged response for harmonic tones compared with noise, measured by dividing the difference between responses to the two types of conditions by their sum. D, Pitch discrimination thresholds. Amusics' thresholds were higher on average than controls, but the amusic population was heterogeneous, consistent with prior reports (Tillmann et al., 2009; Liu et al., 2010). Four amusic subjects (bolded circles) had particularly high thresholds (>1 semitone) and were analyzed separately. E, Time-averaged response of pitch voxels for high-threshold amusics and their matched controls (same format as B). F, Selectivity of pitch-responsive voxels in high-threshold amusics and their matched controls (same format as C). Error bars in A, B, and E represent 1 SE of the mean difference between responses to harmonic tones and noise across subjects (computed via bootstrap); error bars in C and F represent 1 SE of the plotted selectivity measure across subjects (computed via bootstrap).

