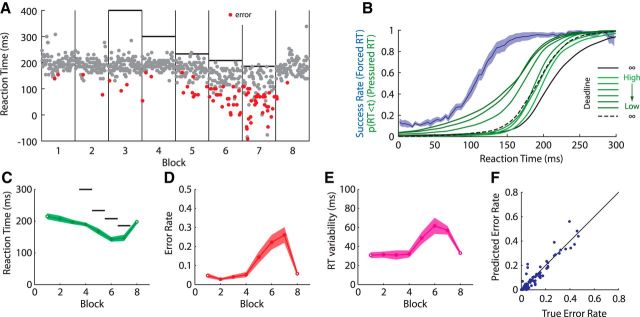
Figure 5.
Motivation influenced RT but not TP. A, RT as a function of trial number in each block for a representative participant. Gray circles indicate accurately initiated movements. Red circles indicate errors. Vertical gray lines indicate block boundaries. Horizontal black lines indicate initiation deadline. B, Blue line, Moving average of the probability of accurate movement initiation as a function of RT, determined from the Forced RT condition. Shaded region indicates ±SEM across 12 participants. Black lines indicate cumulative RT distribution in first and last (Free RT) blocks (solid, first; dashed, last). Green lines indicate cumulative RT distribution in each block in the Pressured RT condition (lighter, longer deadline; darker, shorter deadline). C, Mean RT across participants. Open circles indicate blocks with no RT deadline. Filled circles indicate blocks with a deadline. Black horizontal lines indicate deadlines (where this fits within axes). Shaded regions indicates ±SEM across participants. D, Error rate. E, Variability in RT. F, True versus predicted error rate for each block, for each participant.

