
Figure 1.
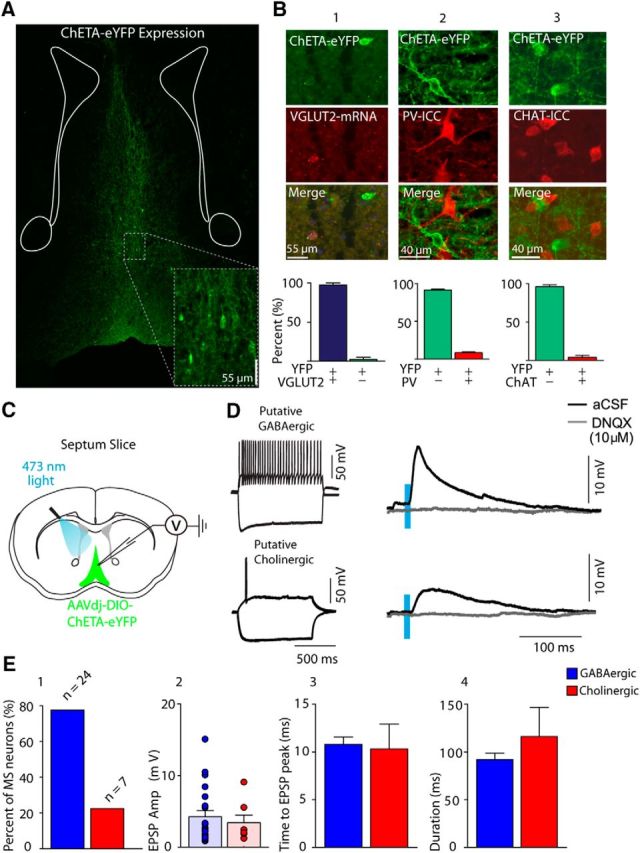
Optogenetics and MS-DBB glutamatergic neurons. A, Coronal section showing ChETA-eYFP expression from MD-DBB VGLUT2 neurons and fibers. B, ChETA-eYFP expression compared with the following: B1, VGLUT2 mRNA (of 335 neurons, eYFP/VGLUT2 mRNA: 96.8 ± 1.3%, eYFP only: 3.3 ± 1.3%); B2, PV (751 neurons, eYFP-positive: 91.5 ± 1.3%, positive for both markers: 8.6 ± 1.6%); B3, ChAT, (576 neurons counted, eYFP-positive: 95.9 ± 2.6%, positive for both markers: 4.1 ± 2.6%). C, Diagram representation of experimental setup for patch-clamp recordings in septum slice. D, Cell characterization of ChETA-negative neuron (left) and EPSP in response to 10 ms duration light pulses in either regular aCSF or DNQX (10 μm). E1, Percentage of MS-DBB neurons patched and sorted by firing properties (either putative GABAergic or cholinergic). E2, EPSP amplitude for each cell type. E3, Time to peak. E4, EPSP duration.