Figure 6.
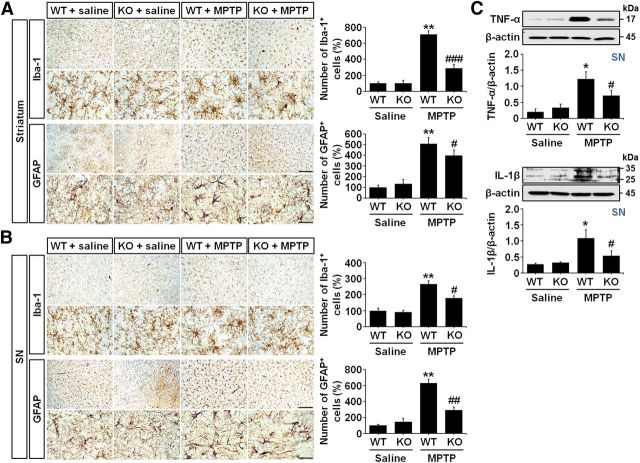
MPTP-induced glial activation is attenuated in LCN2-deficient mice. A, Images of striatal immunohistochemical staining with anti-Iba-1 and anti-GFAP antibodies for microglia and astrocytes, respectively, after saline or MPTP treatment. Scale bars, 100 and 25 μm (higher-magnification images). The histograms indicate the number of microglia (top) and astrocytes (bottom) in the striatum. **p < 0.001 versus saline-treated WT mice; ###p < 0.001 and #p < 0.05 versus MPTP-treated WT mice (two-way ANOVA; n = 4 for saline groups, n = 5 for MPTP groups). B, Nigral immunohistochemical images of staining with anti-Iba-1 and anti-GFAP antibodies after saline or MPTP treatment. Scale bars, 100 and 25 μm (higher-magnification images). Similar to the results in the striatum, increases in the numbers of microglia and astrocytes are observed in the SN of the WT mouse brains after MPTP treatment compared with the saline-treated controls. However, those increases are reduced significantly in LCN2-deficient mice. **p < 0.001 versus saline-treated WT mice; #p < 0.05 and ##p < 0.01 versus MPTP-treated WT mice (two-way ANOVA; n = 4 for saline groups, n = 5 for MPTP groups). C, Western blot analysis of TNF-α and IL-1β expression in the SN of mouse brains 3 d after MPTP treatment. Representative gel images show that MPTP administration induces significant increases in TNF-α and IL-1β expression in the SN of WT mice (p < 0.01 vs saline-treated WT mice). However, the upregulation of the cytokine levels in the SN of WT mice is attenuated in the SN of LCN2-deficient mice. *p < 0.01 versus saline-treated WT mice; #p < 0.05 versus MPTP-treated WT mice (two-way ANOVA; n = 3 for each group).

