Figure 7.

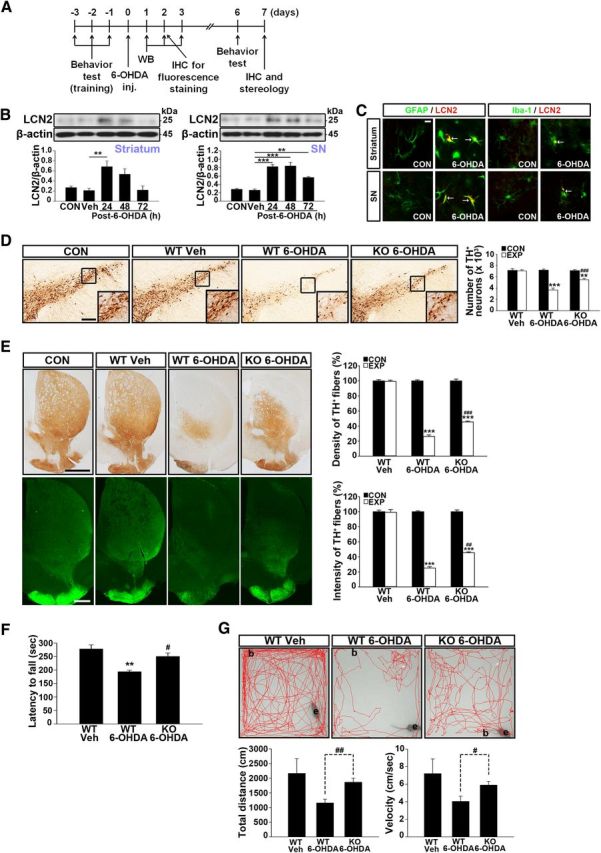
LCN2 deficiency protects the nigrostriatal DA projection in the 6-OHDA-treated animal model of PD. A, Diagram of the experimental design to determine whether intrastriatal injection of 6-OHDA induces LCN2 upregulation in the nigrostriatal DA system in the adult brain. B, Western blot analyses of the levels of LCN2 expression in the striatum and SN of mouse brains. ***p < 0.001 and **p < 0.01 in the striatum and SN, respectively, versus vehicle controls (one-way ANOVA; n = 4 for each group). C, Colocalization of LCN2 expression with glial cells in the striatum and SN by double immunofluorescence staining 48 h after 6-OHDA treatment. Scale bar, 10 μm. Arrows indicate colocalization of LCN2 and astrocytes/microglia. D, Number of TH-positive neurons in the SN. Scale bar, 200 μm. ***p < 0.001 and **p < 0.01 versus vehicle controls; ###p < 0.001 versus 6-OHDA-treated WT mice (one-way ANOVA; n = 4 for each group). CON, Contralateral control side; EXP, ipsilateral injected side. E, Optical densities (ODs) of TH-positive fibers in the striatum. Scale bars, 1000 μm (top) and 500 μm (bottom). ***p < 0.001 in immunoperoxidase staining versus vehicle controls; ###p < 0.001 in immunoperoxidase staining versus 6-OHDA-treated WT mice; ***p < 0.001 in immunofluorescence staining versus vehicle controls; ##p < 0.01 in immunofluorescence staining versus 6-OHDA-treated WT mice (one-way ANOVA; n = 4 for each group). F, G, Movement impairment analyses by the rotarod and open-field tests. **p < 0.01 and #p < 0.05 in the results of the rotarod test (F) versus vehicle-treated mice and 6-OHDA-treated WT mice, respectively (one-way ANOVA; n = 4 for each group). #p < 0.05 and ##p < 0.01 in the results of the open-field test (G) versus 6-OHDA-treated WT mice (t test; n = 4 for each group).
