
Figure 1.
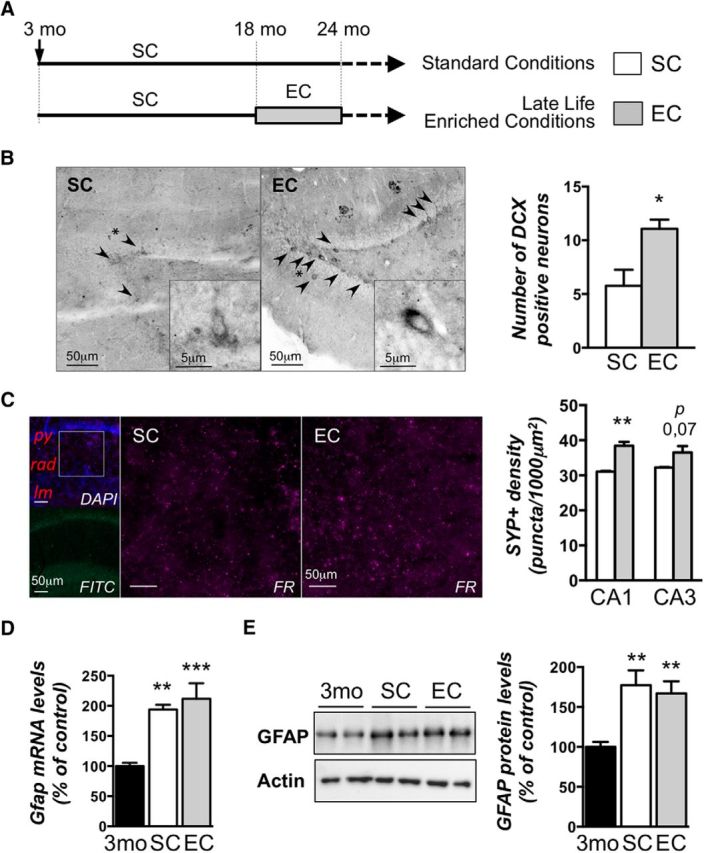
Enriched environment housing conditions applied in late life for aged rats increases plasticity in the hippocampus without impacting inflammation. A, Experimental design. A cohort of 5-week-old rats was housed in pairs over 18 months (standard conditions). Then, rats were randomly kept in standard conditions or assigned to enriched conditions for another 6 month period, after which the 24-month-old rats were placed in individual cages for 20 d. B–E, A subgroup was used for baseline assessments: immunostological (B, C) or biochemical (D, E) analyses. Three-month-old rats (3mo) placed in standard conditions were used as young controls (D, E). B, Hippocampal neurogenesis was evaluated by immunohistochemical detection of the immature neuronal marker DCX in the dentate gyrus subgranular zone from aged rat groups (SC and EE) under basal conditions. Arrowheads indicate DCX positive neurons, and asterisks indicate the neuron focused on in the inset. DCX-positive neurons were counted, and data are expressed as mean ± SEM (n = 4 per group). *p < 0.05 (SC vs EE; Student's t test). A significant increase of the number of DCX-positive cells in the dentate gyrus of aged rats exposed to EE compared to those reared in standard conditions is observed. C, Synapse densities were visualized by synaptophysin immunolabeling (FR) in the CA1 and CA3 regions of the dorsal hippocampus. Typical photographs observed in the CA1 area are shown for SC and EC rats. The inset in the photograph on the left (top, DAPI) represents the region of CA1 that was investigated. py, Pyramidal layer; rad, stratum radiatum; lm, stratum lacunosum moleculare. The FITC photograph below shows the background fluorescence of lipofuscin typically observed in the brains of aged animals. The synapse density is represented as the number of puncta per square 1000 micrometers counted in each photograph (3–5 slices/animal; n = 3–4/group). **p = 0.0025. D, mRNA expression of the glial marker GFAP was evaluated by RT-qPCR in the dorsal hippocampi of young adult rats (3mo) housed in standard conditions and aged rats (24 months of age) housed either in standard conditions or enriched conditions. Values were normalized to the RNA polymerase II expression levels. Data are expressed as mean ± SEM (n = 7–8 per group) with the percentage relative to the young control group arbitrarily set at 100%. **p < 0.01; ***p < 0.001 [NK post hoc comparisons after one-way ANOVA, significantly different from control (3mo) group]. E, GFAP protein levels were assessed by Western blot in nuclear protein extracts from the dorsal hippocampi of the three previously described groups. Typical blots are shown in duplicates. Blots were quantified, and the results are expressed as mean ± SEM (n = 4–5 per group) with the percentage relative to the control group arbitrarily set at 100%. **p < 0.01 [NK post hoc after one-way ANOVA, significantly different from the control (3mo) group].