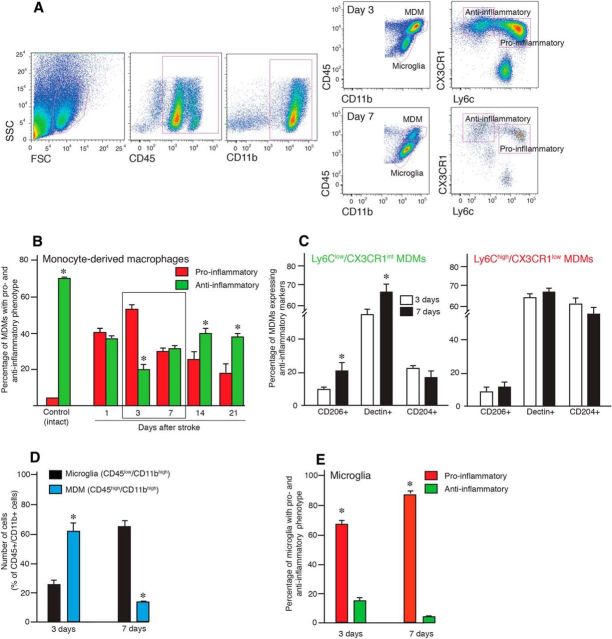
Figure 7.
MDMs switch from a proinflammatory to anti-inflammatory phenotype during the first weeks after stroke. A, Flow cytometry analysis of the brain hemisphere ipsilateral to the lesion in mice subjected to stroke and killed 3 and 7 d thereafter. CD45/CD11b immunoreactivity is used to distinguish MDMs and microglia and CX3CR1/Ly6C to define proinflammatory and anti-inflammatory phenotype of MDMs. B, Changes as a function of time in percentage of MDMs with a proinflammatory and anti-inflammatory phenotype defined by flow cytometry analysis in the ischemically injured brains; intact hemispheres were used as controls. C, Estimation of the percentage of CD204+, CD206+, and Declin+ cells within the MDM population in the injured hemisphere of mice subjected to stroke and killed 3 and 7 d thereafter. D, Estimation of the percentage of microglia and MDMs in injured hemisphere of mice subjected to stroke and killed 3 and 7 d thereafter. E, Estimation of the percentage of microglia with a proinflammatory and anti-inflammatory phenotype in the injured hemisphere of mice subjected to stroke and killed 3 and 7 d thereafter. SSC, Side scatter; FSC, forward scatter. Number of animals: Control, n = 4; Day 1, n = 3; Day 3, n = 12; Day 7, n = 7; Day 14, n = 5; and Day 21, n = 6. Data are means ± SEMs; *p < 0,05, unpaired t test between the proinflammatory and anti-inflammatory phenotype (B, E), 3 and 7 d (C), and microglia and MDMs (D).

