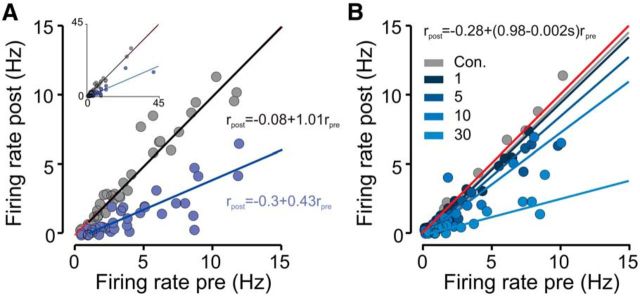
Figure 3.
Suppression of average aPC spontaneous activity linearly scales with baseline firing rate. A, Scatter plot comparing firing rates under control and photostimulated trials for all significantly inhibited units (n = 38). A linear regression fit is superimposed. Two outlying points were excluded from the main plot for clarity purposes and are shown in the inset. The linear regression equations are shown next to the corresponding regression lines. B, Same as A for a subpopulation of neurons that were photostimulated with 1, 5, 10, and 30 Hz (n = 15). Con., Control.

