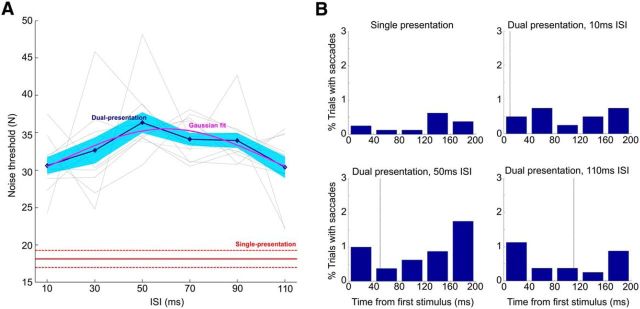
Figure 3.
Experiment 1 results. A, Performance on the shape discrimination task, in terms of threshold noise (number of distractor elements) at 75% correct. Red, Mean and SEM of the single presentation condition; blue, mean and SEM of the dual presentation condition; magenta, Gaussian fit. Pale gray lines represent individual subjects, shifted vertically to match the global average. B, Eye movement control experiment. Plots show percentage of trials in which observers made a saccade away from fixation, as a function of time relative to onset of the first target shape presentation. The vertical dashed line indicates the onset of the second target shape presentation.

