Figure 1.
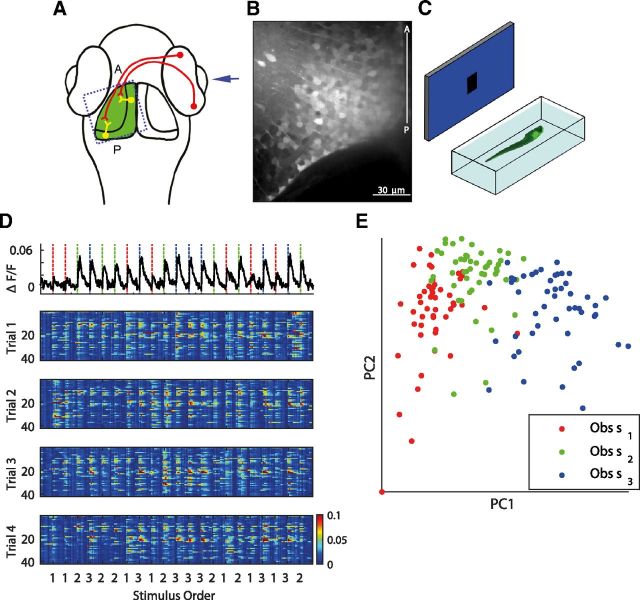
The population response is variable and largely overlapping. A, Dorsal view of the zebrafish head. Visual information enters the eye and is conveyed to the contralateral tectum via retinal ganglion cell axons, which synapse to the dendrites of the tectal SPV cells. Dotted, blue square indicates the region being imaged. The anterior (A) and posterior (P) ends of the tectum are indicated. B, A labeled tectum after injection of OGB. Middle-third of the tectum is cropped. C, Schematic of the visual stimulation assay. A zebrafish embedded in a chamber was imaged using confocal spinning disk microscopy. The eye contralateral to the labeled tectum was presented with a screen onto which the visual stimuli were projected. Visual stimuli consisting of 10° spots at three different positions (−10°, 0°, 10°) were randomly presented for 1 s each, followed by 8 s of blank screen. D, Top, Calcium signal from a randomly chosen cell. Dashed vertical lines represent the onset of spot presentations (red, −10°; green, 0°; blue, 10°). This particular cell responded to all three stimuli and showed variability in response amplitude to the same stimulus. Bottom, Multi-trial raster plot of evoked calcium transients induced in a population of 42 tectal cells (4 of 7 trials are shown) with many cells active due to the three stimuli presented. Stimuli were presented in a random order. E, Population response vectors projected onto the two-dimensional space defined by the first two principal components. The identity of the stimulus which evoked the response (dots) is color-coded.

