Figure 2.
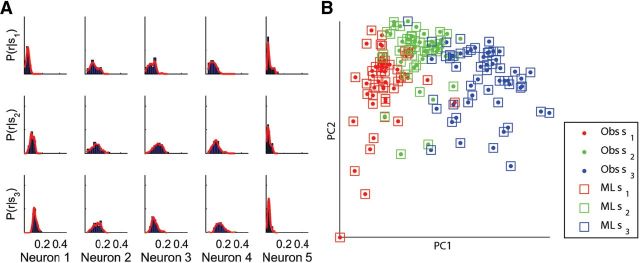
Maximum likelihood decoding. A, Normalized histograms of cell responses due to each of the stimuli (blue bars) and their estimated probability density (red curve; 5 different cells are shown). B, Population response vectors projected onto the two-dimensional space defined by the first two principal components for one fish. The identity of the stimulus which evoked the response (dots) is color-coded as in Figure 1E. Decoded stimuli (color-coded) are also shown for each untrained population response using the ML decoder (squares). Performance is given by the percentage of observations which were decoded correctly, for this fish 97%.

