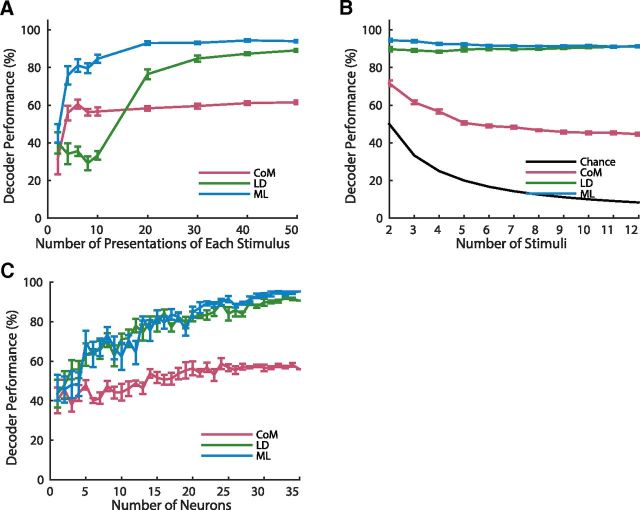
Figure 6.
Performance of the decoders. A, Decoder performance as a function of the number of presentations of each stimulus, demonstrating that LD required more training to perform optimally. B, Decoder performance as a function of the number of stimuli discriminated, demonstrating that ML decoder is robust to the number of stimuli decoded, whereas CoM showed a decrease in performance. Mean and SEM from 10 simulations shown in A and B. C, The neuron dropping curve, showing performance as a function of the number of neurons used to perform the decoding. The performance rapidly saturated as the number of neurons increased as in the experimental data (Fig. 4C). Mean and SEM shown from five random subsets of neurons for each number of neurons.

