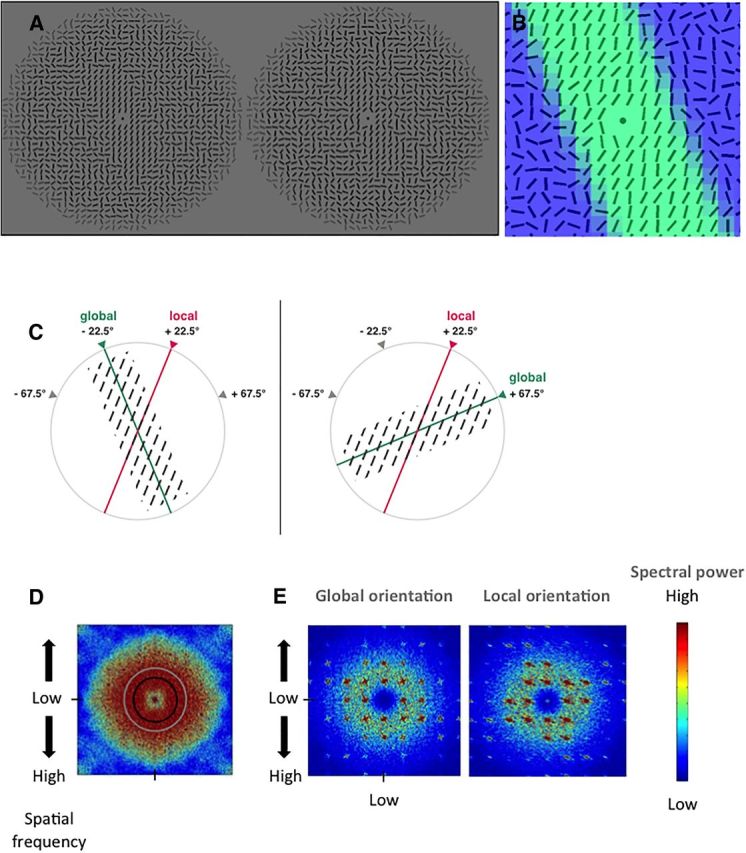
Figure 2.

Stimuli. A, Two examples of the stimuli, at two coherence levels (left, κ = 20, high coherence level for presentation purpose; right, κ = 4, a coherence level representative of the stimuli used in the present study). The local and global orientations (22.5°, −22.5° respectively, vertical reference) are illustrated in C. B, Schematic representation of the coherence (κ) values within a stimulus. There is a smooth decrease of the coherence between the global oriented shape and the background: green represents maximal coherence (κ = 5); dark blue represents minimal coherence (κ = 0, random orientations). C, A local orientation was always combined with a global orientation at ±45° (modulo 180°) from the local orientation, and vice versa. In this example, a local orientation at 22.5° is combined with a global orientation of either −22.5° (left) or 67.5° (right). Orientations were 67.5°, 22.5°, −67.5°, and −22.5°, defining eight possible combinations of local and global orientations. D, 2D-Fourier spectrum of the stimuli. Low spatial frequencies are presented in the center. The frequency cutoff of the filters used in the control experiment on the role of spatial frequency (5.7 and 7.9 cpd) are indicated by a black and a light gray circle respectively. E, The 2D spectra of the global orientation (left) and of the local orientation (right), were derived from the subtraction of the Fourier spectrum of stimuli of different global orientations, and of different local orientations, respectively (for details, see Material and Methods). The spatial frequency domains supporting global and local orientation information were largely overlapping.
