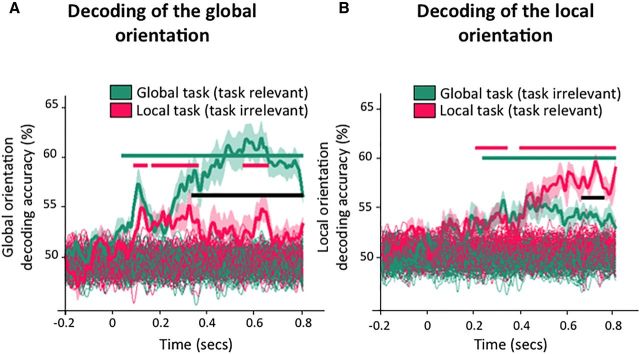
Figure 5.
Experiment 2. Time course of the accuracy of the decoding of the global orientation and of the local orientation from MEG data. A, Decoding accuracy (thick lines) of the global orientation, averaged across subjects, in the global task where global orientation is task-relevant (green) and in the local task (pink) where global orientation is task-irrelevant. The global orientation could be decoded in both tasks. B, Decoding accuracy of the local orientation, averaged across subjects, in the local task where local orientation is task-relevant (pink) and in the global task (green) where local orientation is task-irrelevant. The local orientation could be decoded in both tasks. A, B, Thick lines indicate the decoding accuracy from the MEG data. Thin dotted lines indicate decoding accuracy >100 shuffled datasets and represent an estimate of chance level. Green and pink horizontal bars represent time windows with a better-than-chance decoding of global orientation in the global and local task, respectively (Clustering test, Monte-Carlo p < 0.01 one-tailed, corrected for multiple comparison). Black bar represents significant between-tasks differences.

