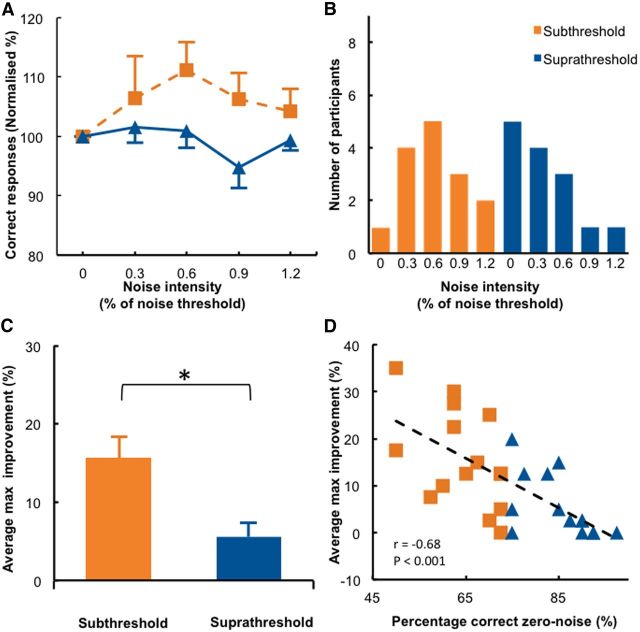
Figure 3.
Results when noise is added to the visual stimulus (visual–noise experiment). A, Detection accuracy relative to the zero noise condition is shown for each noise level in the subthreshold and suprathreshold stimulus groups. B, Distribution of the individual optimal noise levels (defined as the noise intensity that yields maximum accuracy detection). C, A comparison between the average maximum improvement (i.e., the percentage difference between maximum accuracy and zero noise accuracy) showed a significant difference between the subthreshold and suprathreshold groups. *p < 0.05. D, We found a significant correlation between baseline performance and maximal improvement, indicating that participants with low detection accuracy in the zero noise condition benefited most from adding optimal noise. Error bars indicate SEs.

