Figure 1.
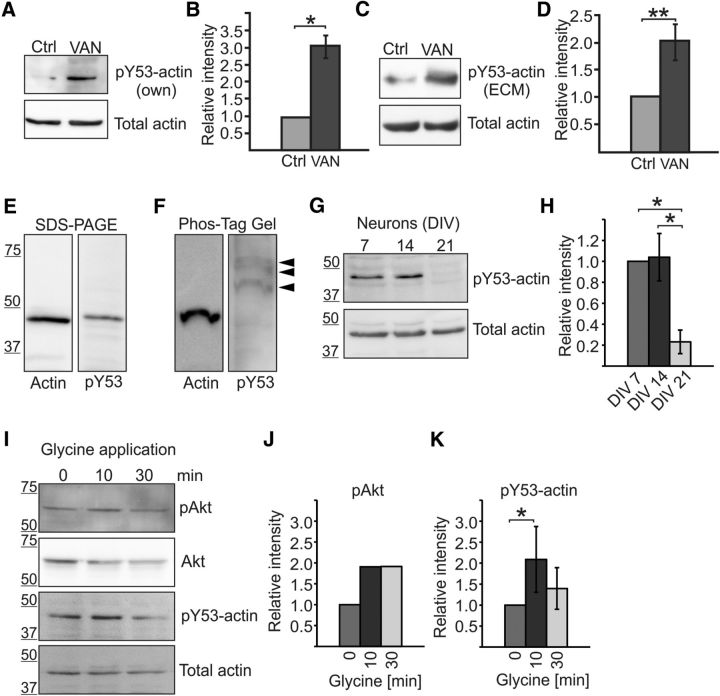
Amount of actin Y53 phosphorylation changes during neuronal maturation and upon glycine application in cortical neurons. A, Western blot using pY53-actin-specific antibody shows that actin is phosphorylated in hippocampal neurons and the level of phosphorylation increases with Na3VO4 treatment. The total amount of actin was controlled using AC-15 actin antibody. VAN, 15 min 1 mm Na3VO4 treatment. B, Quantification of blots in A shown as the ratio of pY53-actin/total actin normalized to control. Graph represents four independent experiments. The amount of recognized phosphorylated actin was increased 3.0-fold by phosphatase inhibition. *p < 0.05, nonparametric Kruskal–Wallis test. C, Similar experiment as in A, but pY53-actin was detected using commercial pY53-actin antibody (ECM, ECM Biosciences) and cortical neuron cultures were used. D, Quantification of blots in C shown as the ratio of pY53-actin/total actin normalized to control. Graph represents five independent experiments. The amount of recognized phosphorylated actin was increased 2.0-fold by phosphatase inhibition. **p < 0.01, nonparametric Kruskal–Wallis test. E, F, Actin and pY53-actin migrated at similar speeds in normal SDS-PAGE gels (E), but phosphorylated actin migrated more slowly in Phos-tag gel (F). Commercial pY53-actin antibody (ECM Biosciences) detected three different bands in Phos-tag gel but no bands the size of nonphosphorylated actin. Data represent three independent experiments. G, Cortical neurons were cultured for 7, 14, and 21 DIV and lysates were run on SDS-PAGE and blotted against pY53-actin (ECM Biosciences) or total actin (AC-15). H, Quantification of G revealing that Y53 phosphorylation decreases by DIV21 (relative phosphorylation amounts: DIV7 = 1.0, DIV14 = 1.0, DIV21 = 0.2). Graph represents three analyzed blots (two different antibodies) from two independent experiments. *p < 0.05, nonparametric Kruskal–Wallis test. I, Freshly diluted 200 μm glycine in HBS was applied to DIV14 cortical cultures for 3 min after a 10 min incubation with blockers TTX, strychnine, and picrotoxin. Cells were then washed using HBS and lysed after a 10- or 30 min incubation in HBS. Samples were blotted against pAkt, Akt, pY53-actin (ECM), and total actin. J, pAkt levels were increased 1.9-fold 10 and 30 min after glycine application. K, The amount of pY53-actin was increased 2.1-fold 10 min after glycine application, but the increase in phosphorylation diminished after 30 min (1.4-fold increase compared with preinduction). Graph represents four independent experiments. *p < 0.05, nonparametric Kruskal–Wallis test. Data are represented as mean ± SEM.

