Figure 3.

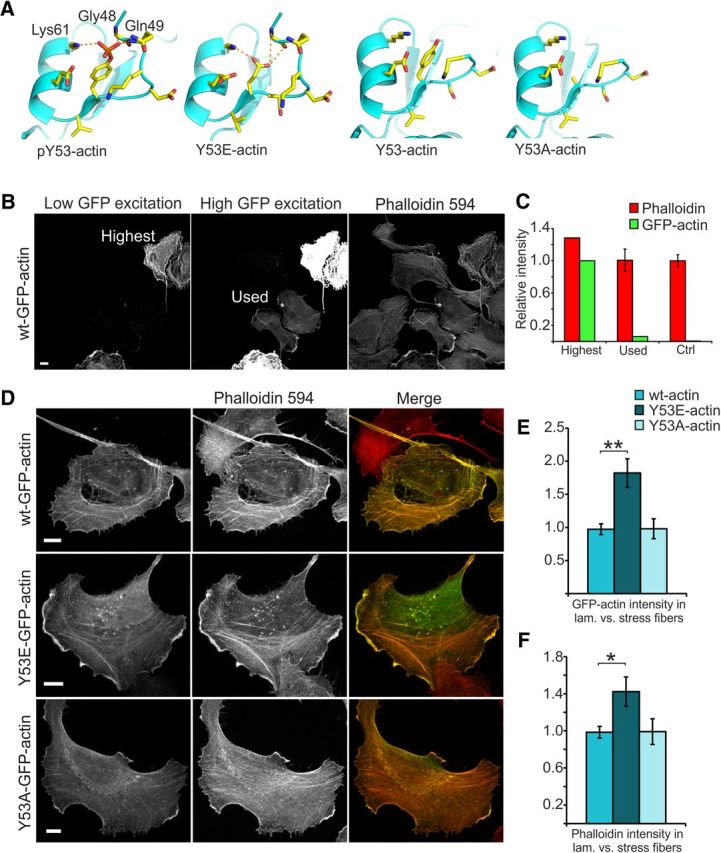
Low levels of Y53E-actin expression enhance the development of lamellipodia and hinder the establishment of stress fibers. A, Actin structures visualizing Y53 and adjacent amino acids. Generated mutations (Y53E and Y53A) visualized by modeled structures. Y53 phosphorylation results in the formation of hydrogen bonds with amino acids Gly48, Gln49, and Lys61, stabilizing the D-loop. Y53E mutation generates a negative charge mimicking the phosphorylated form of actin. Putative hydrogen bonds are indicated in the image. In the nonphosphorylated form and the Y53A mutation, the D-loop is flexible and thus not seen in the structure. Images were generated using the program PyMOL (http://pymol.sourceforge.net/) starting from the structures PDB 3CI5 (pY53-actin) and PDB 3CI5 (nonphosphorylated actin; Baek et al., 2008). B, Images taken of U2OS cells with high and low laser powers reveal different levels in GFP-actin expression and how GFP-actin expression levels affect phalloidin staining intensity. Scale bar, 10 μm. C, When the GFP intensity in the high-expressing cell shown in B is set to 100%, ImageJ intensity analysis reveals that the low-expressing cells used in these experiments express only 6% of this maximum expression level. The intensity of phalloidin staining in these low-expressing cells is the same as in nontransfected controls. D, F-actin staining (phalloidin-594) of U2OS cells expressing GFP-(wt/Y53E/ Y53A)-actin. Scale bars, 10 μm. E, GFP-actin constructs are distributed differently between lamellipodial actin and stress fibers: wt ratio = 1.0 (similar intensity in lamellipodium and in stress fibers); Y53E ratio = 1.8; Y53A ratio = 1.0. Data in E and F represent n(wt) = 17, n(Y53E) = 14, n(Y53A) = 11 cells pooled from two independent experiments. **p < 0.01 one-way ANOVA with Bonferroni's post hoc test. F, Overexpression of GFP-Y53E-actin causes a shift toward lamellipodial actin: wt ratio = 1.0 (similar intensity in lamellipodium and in stress fibers), Y53E ratio = 1.4, Y53A ratio = 1.0. *p < 0.05 one-way ANOVA with Bonferroni's post hoc test. Data are represented as mean ± SEM.
