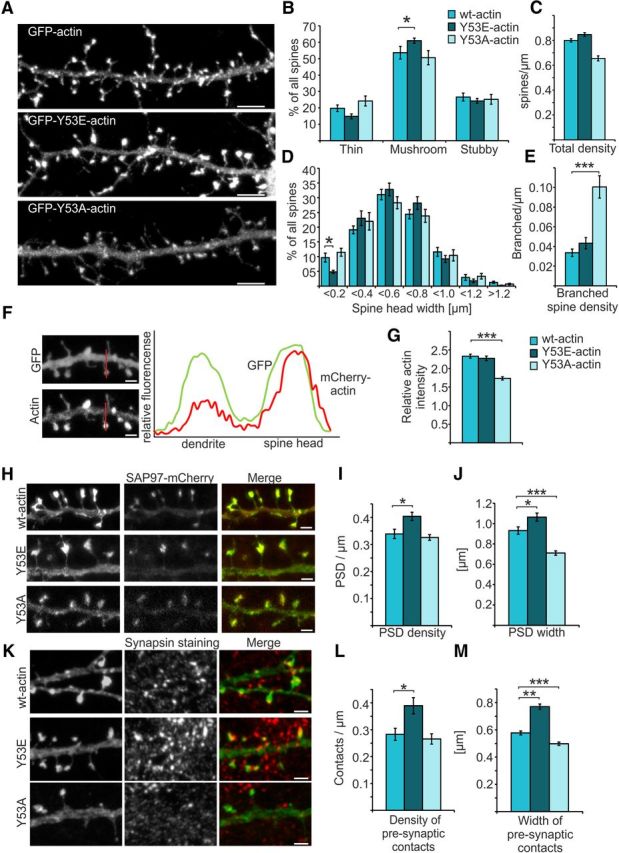
Figure 4.

Expression of mutant actin mimicking pY53-actin increases the proportion of mushroom-shaped dendritic spines. A, GFP-actin-, GFP-Y53E-actin-, and GFP-Y53A-actin-expressing primary hippocampal neurons at DIV14. Scale bars, 5 μm. B, C, Quantification of spine morphology from neurons cotransfected with mCherry-actins and free GFP revealed an increased proportion of mushroom spines in mCherry-Y53E-actin expressing neurons. Proportions of thin, mushroom, and stubby spine morphologies: wt: 20% thin, 54% mushroom, 27% stubby, total density = 0.80 spines/μm; Y53E: 15% thin, 61% mushroom, 24% stubby, total density = 0.83 spines/μm; Y53A: 24% thin, 51% mushroom, 25% stubby, total density = 0.66 spines/μm. Data in B–E represent n(wt) = 15 cells, 986 spines, 1342 μm of dendrite; n(Y53E) = 19 cells, 1522 spines, 1998 μm of dendrite; n(Y53A) = 15 cells, 1119 spines, 1587 μm of dendrite pooled from four independent experiments.*p < 0.05 one-way ANOVA with Bonferroni's post hoc test. D, Size distribution of spines analyzed in B and C. Spines are grouped with 0.2 μm intervals. Spines with small heads (<0.2 μm) were significantly reduced in Y53E-actin-expressing neurons. E, GFP-Y53A-actin induces branching of spine heads. Branched spine densities: wt = 0.03, Y53E = 0.04; Y53A = 0.10 spines/μm. ***p < 0.001 one-way ANOVA with Bonferroni's post hoc test. F, Free GFP and mCherry-actin expressed in a primary hippocampal neuron. Expression plot profile was generated from the line shown in the picture. Distribution of actin between spine and dendrite was measured and normalized to GFP signal. Scale bars, 1 μm. G, mCherry-Y53A-actin showed a reduced concentration in spine heads compared with wt- and mCherry-Y53E-actin. Head versus dendrite localizations: wt = 2.3, Y53E = 2.3, Y53A = 1.7. Data represent n = 10 cells, 100 spines for each actin construct pooled from two independent experiments. ***p < 0.001 one-way ANOVA with Bonferroni's post hoc test. H, PSD densities and sizes of PSDs of GFP-(wt/Y53E/Y53A)-actin expressing cells were analyzed based on PSD labeling by SAP97-mCherry. Scale bars, 1 μm. I, Quantification shows that PSD density was significantly increased in cells expressing GFP-Y53E-actin. Density of PSDs: wt = 0.34 PSD/μm, n = 17 cells, 1707 μm of dendrite; Y53E = 0.40 PSD/μm, n = 14 cells, 1394 μm of dendrite; Y53A = 0.33 PSD/μm, n = 14 cells, 1227 μm of dendrite. Data are pooled from two independent experiments. *p < 0.05 one-way ANOVA with Bonferroni's post hoc test. J, Quantification of PSD widths shows that PSD sizes were significantly increased in cells expressing GFP-Y53E-actin together with SAP97-mCherry, whereas, in cells expressing GFP-Y53A-actin, PSD accumulations were significantly smaller. PSD width: wt = 0.9 μm, n = 10 cells, 270 spines with PSD; Y53E = 1.1 μm, n = 10 cells, 235 spines with PSD; Y53A = 0.7 μm, n = 10 cells, 341 spines with PSD. Data are pooled from two independent experiments. *p < 0.05, ***p < 0.001, one-way ANOVA with Bonferroni's post hoc test. K, Presynaptic site densities and widths of synapsin staining next to GFP-(wt/Y53E/Y53A)-actin expressing spines. Scale bars, 1 μm. L, Quantification shows that presynaptic site density was significantly increased in cells expressing GFP-Y53E-actin. Densities: wt = 0.28 presynaptic contacts/μm, n = 14 cells, 1070 μm of dendrite; Y53E = 0.39, n = 12 cells, 835 μm of dendrite; Y53A = 0.27, n = 13 cells, 1031 μm of dendrite. Data are pooled from three independent experiments. *p < 0.05 one-way ANOVA with Bonferroni's post hoc test. M, Quantification of the width of presynaptic contacts shows that widths were significantly increased in cells expressing GFP-Y53E-actin, whereas, in cells expressing GFP-Y53A-actin, synapsin accumulations were significantly reduced. wt = 0.58 μm, n = 6 cells, 241 pre synaptic sites; Y53E = 0.77 μm, n = 4 cells, 269 presynaptic sites; Y53A = 0.50 μm, n = 8 cells, 252 presynaptic sites. Data are pooled from two independent experiments. **p < 0.01, ***p < 0.001, one-way ANOVA with Bonferroni's post hoc test. Data are represented as mean ± SEM.
