
Figure 6.
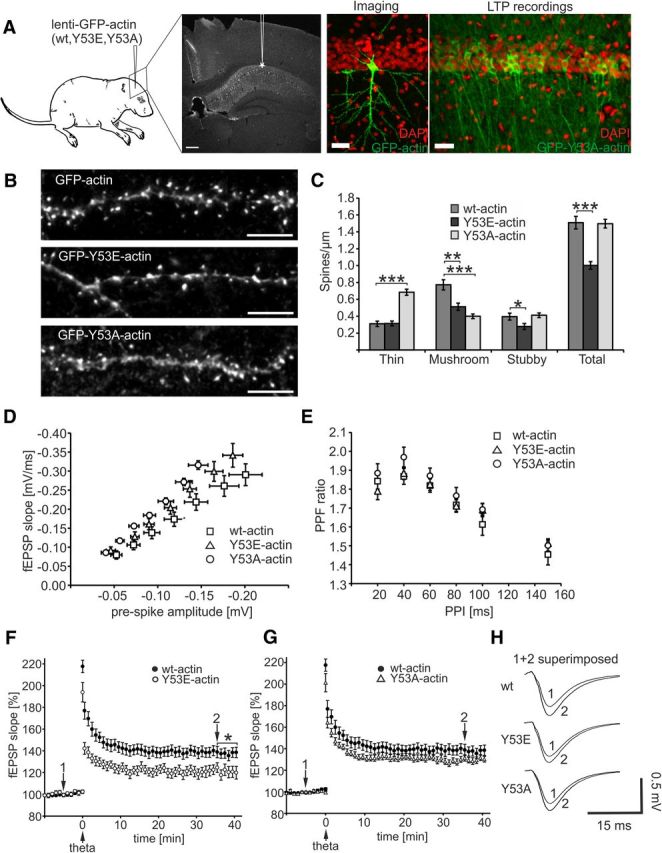
Expression of Y53E-actin in rat hippocampus decreases dendritic spine density and attenuates LTP formation. A, Lentiviral transduction was performed at P1–P4 in rat hippocampi. Higher-magnification confocal images of the CA1 area show transduction efficiency used for imaging and for LTP recordings. DAPI nuclear staining is shown in red, GFP-actin fluorescence in green. Transduction efficiency in slices used for LTP recording is ∼35%. Scale bars, 10 μm. B, Dendrites of CA1 pyramidal hippocampal neurons at P15–P19 expressing GFP-tagged wt-, Y53E-, or Y53A-actin. Similar to wt, GFP-Y53E-actin localizes to spines, whereas GFP-Y53A-actin shows shaft localization. Scale bars, 5 μm. C, Quantification of spine morphology reveals that the total spine number is diminished in neurons expressing GFP-Y53E-actin. Expression of GFP-Y53A-actin shifts spine type distribution to thin spines without altering the total spine density: wt: thin = 0.31, mushroom = 0.77, stubby = 0.40, total = 1.51 spines/μm; n = 11 cells, 1235 spines, 821 μm dendrite, pooled from 3 rats; Y53E: thin = 0.31, mushroom = 0.51, stubby = 0.28, total = 1.00 spines/μm; n = 10 cells, 795 spines, 746 μm dendrite, pooled from 3 rats; Y53A: thin = 0.68, mushroom = 0.40, stubby = 0.41, total = 1.50 spines/μm; n = 10 cells, 964 spines, 637 μm dendrite, pooled from 3 rats. **p < 0.01, ***p < 0.001, one-way ANOVA with Bonferroni's post hoc test. D, I/O ratios did not differ between slices expressing different actin constructs. The number of recordings from slices expressing wt-, Y53E-, and Y53A-actin constructs were 13 (13 rats), 13 (10 rats), and 17 (12 rats), respectively. E, No significant differences in the PPF were found between the wt-, Y53E-, and Y53A-actin construct groups [n(wt) = 12 (12 rats), n(Y53E) = 14 (13 rats), and n(Y53A) = 14 (12 rats)]. F, G, Pooled data from recordings of fEPSPs in the CA1 of hippocampal slices expressing wt-actin (F, G), Y53E-actin (F),and Y53A-GFP-actin (G). A stimulation interval of 20 s was used and every third response is shown in the graph. TFS was applied at 0 min. At 35–40 min, the fEPSP was potentiated 37 ± 4% [n = 18 slices (13 rats)] in wt-actin-expressing slices, 22 ± 4% [n = 11 (8 rats)] in Y53E-actin-expressing slices, and 30 ± 2% [n = 21 (12 rats)] in Y53A-actin-expressing slices. *p < 0.05, Kruskal–Wallis test with Dunn–Bonferroni post hoc method. H, Superimposed average fEPSP responses at −5 min (1) and 35 min (2) for all groups. Data are represented as mean ± SEM.