Figure 5.
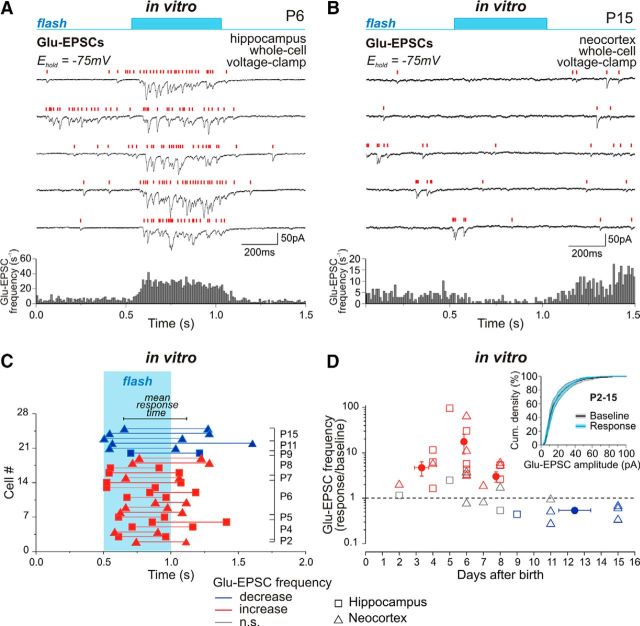
Photoactivation of interneurons induces glutamate release from principal cells in neonatal but not in adolescent mice in vitro. A, B, Example traces of Glu-EPSCs recorded during photostimulation at the reversal potential of GABA-PSCs (−75 mV) in P6 hippocampal (A) and P15 neocortical (B) slices. Red bars indicate individual Glu-EPSCs. Below, Corresponding histograms of Glu-EPSC frequency based on results of 100–110 photostimulation trials. C, The time course of glutamatergic response evoked by the light pulse (highlighted area) at different postnatal ages (blue and red symbols correspond to a decrease and an increase in Glu-EPSC frequency during responses, respectively). Each pair of symbols shows the onset and the end of response recorded from individual hippocampal (squares) or neocortical (triangles) neurons. Animal age is indicated on the right. D, Pooled data on the change in Glu-EPSC frequency during the light pulse in relation to the baseline frequency in hippocampal (squares) and neocortical (triangles) neurons of P2–P15 mice. Color code of symbols is same as in C. The Glu-EPSC frequency during response was calculated within a time window unique to each neuron (displayed in C). Gray symbols correspond to the neurons where no significant change in Glu-EPSC frequency was detected during illumination. Response frequency in these neurons was calculated within the mean-response time window. Closed circles show mean values with SE. Note that photostimulation of interneurons elicits an increase in Glu-EPSC frequency during the first postnatal week and a decrease in Glu-EPSC frequency after P8, indicating a developmental excitatory-to-inhibitory switch in the action of GABA photoreleased from interneurons on glutamatergic neurons. The cumulative distribution of Glu-EPSC amplitudes during baseline activity (black trace) and throughout the photostimulation-evoked response (blue trace) is shown in the inset graph. The shaded area around the curves corresponds to SE bands.

